A PERT chart — Program Evaluation and Review Technique — is a network diagram that models the dependencies between the tasks of a project. Where a Gantt chart shows when work happens, a PERT chart shows what constrains what. It is the view that reveals which chain of tasks actually determines the end date.
Two meanings behind the same acronym
PERT refers to two related things, and confusing them causes real problems.
- The network diagram: a graph of tasks connected by dependency relationships. This is what most people mean by "PERT chart".
- The three-point estimating technique: a way of estimating duration under uncertainty, using an optimistic, most likely and pessimistic value. We cover the arithmetic in the PERT formula and critical path calculation.
Both come from the same 1950s origin. In modern practice the network diagram is used far more widely than the estimating technique, and most tools that advertise "PERT" implement only the first.
How a PERT chart is built
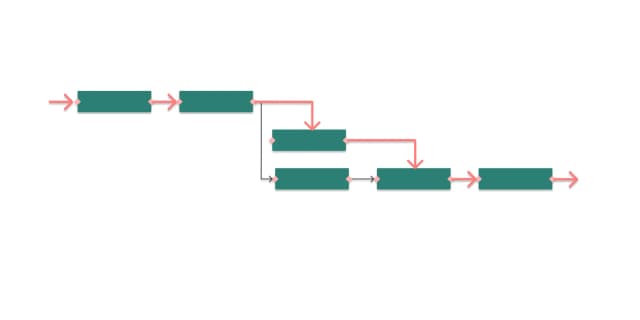
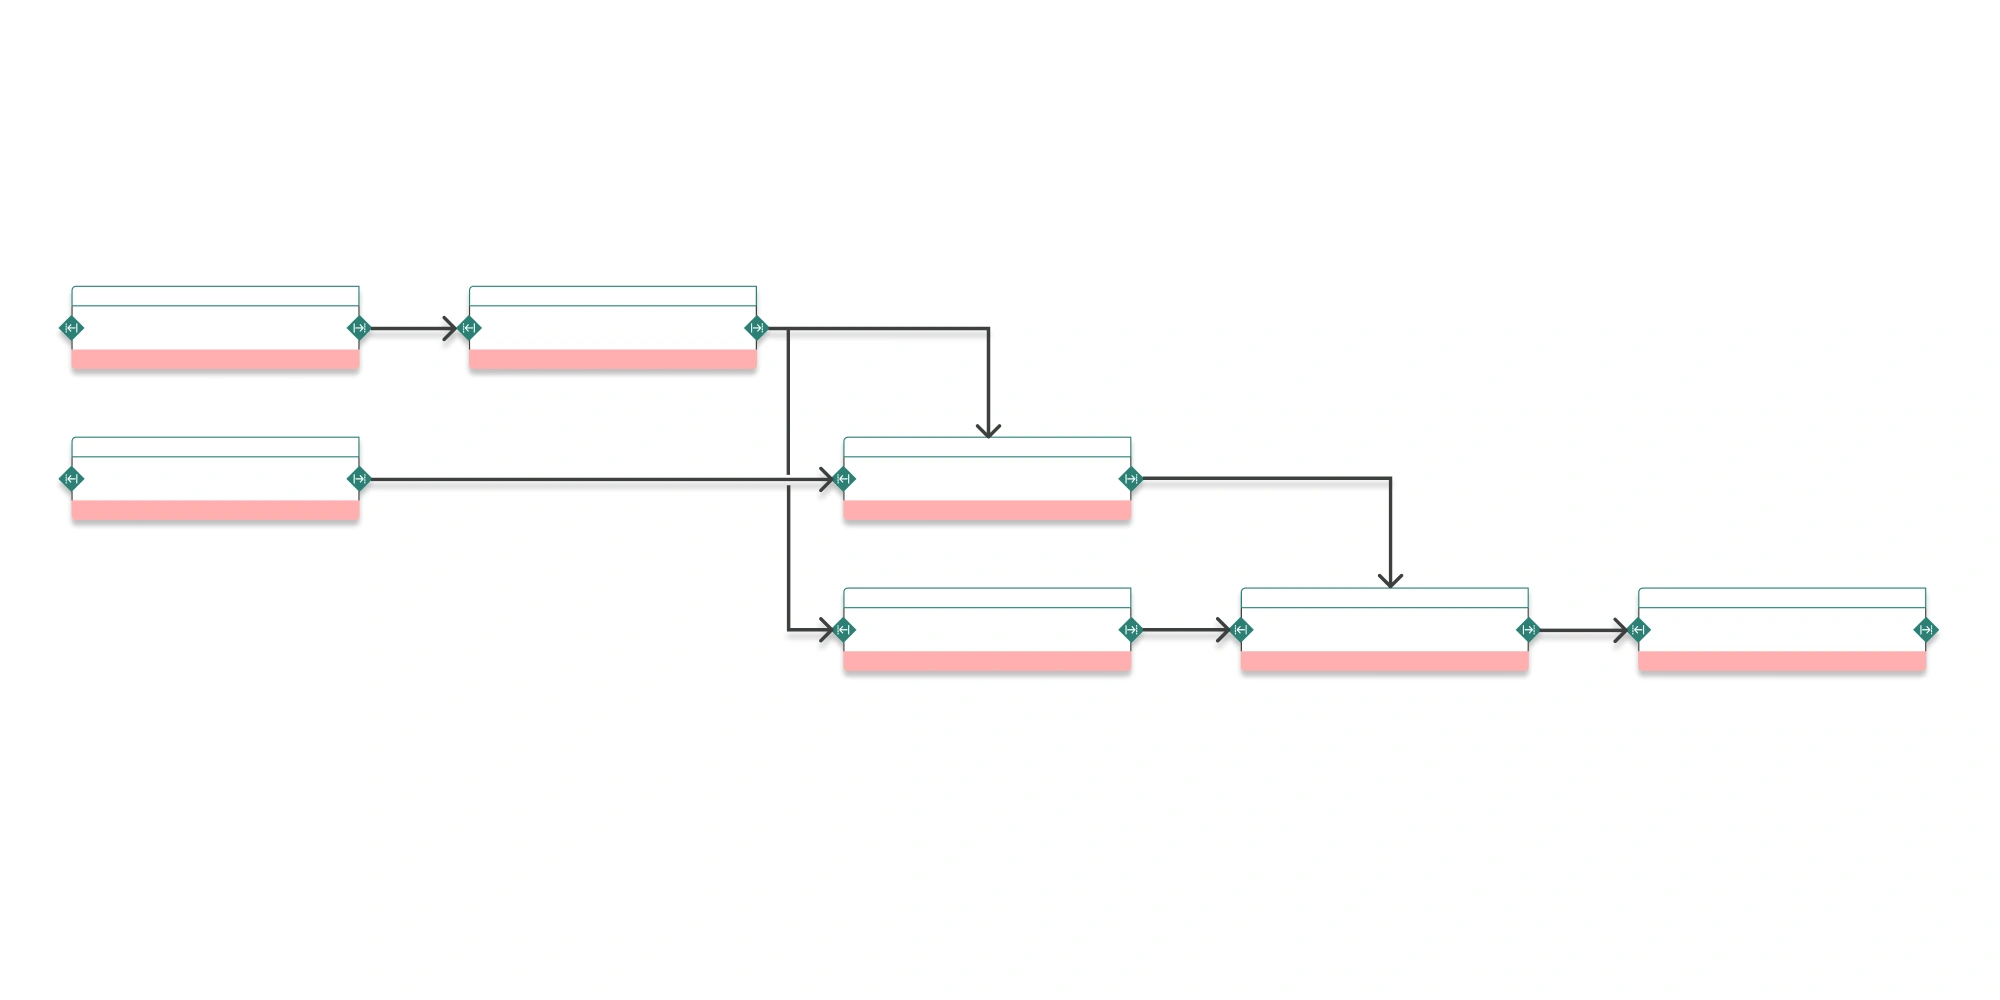
Each node is a task. Each arrow is a constraint: this cannot start until that has finished. The chart carries no calendar — only order.
That absence of dates is the point. A Gantt chart forces you to commit to a start date for every task before you know what the constraints are. A network diagram lets you get the constraints right first, then derive the dates.
The four dependency types
- Finish-to-Start (FS) — B starts once A is finished. By far the most common.
- Start-to-Start (SS) — B can start once A has started.
- Finish-to-Finish (FF) — B cannot finish before A finishes.
- Start-to-Finish (SF) — rare, and usually a sign the relationship has been modelled backwards.
Most projects are modelled almost entirely with finish-to-start links. The other types matter when work overlaps — which is precisely where schedules tend to be optimistic.
What the network reveals that a list cannot
A task list treats every item as equally important. A network does not. Once dependencies are modelled, three things become visible immediately:
- The longest path through the network — the sequence that sets the minimum project duration. This is the critical path.
- Float — how much a task can slip before it affects anything else.
- Convergence points — tasks where several chains meet, which concentrate risk and are the usual source of unpleasant surprises.
None of this is visible in a spreadsheet or a Kanban board. It is the reason dependencies stay invisible until they bite on most projects. A tool built around the dependency network keeps those relationships visible instead of leaving them in someone's head.
PERT versus Gantt: not competitors
The two views answer different questions and are meant to be used in sequence.
- A PERT chart answers: in what order must this happen, and what drives the end date?
- A Gantt chart answers: who is doing what, when?
The correct order is PERT first, Gantt second. A Gantt chart built without a dependency model is a set of bars placed by hand, and it will need to be replaced by hand every time something moves.
PERT and CPM
Both methods sit in the schedule management practices described by the PMI standards, where network analysis precedes the calendar view most teams recognise as the schedule.
PERT and the Critical Path Method (CPM) were developed independently at almost the same time and have largely converged. In current usage, CPM refers to the deterministic calculation of the longest path with fixed durations, while PERT historically carried the probabilistic estimating layer on top. Most modern tools implement CPM arithmetic and call it PERT.
For practical purposes the distinction rarely matters — except when someone promises a probability of hitting a date, which requires the estimating technique and not just the network.