The PERT formula turns three guesses into one defensible number: tE = (O + 4M + P) / 6. This page works through it end to end, with a full numerical example, then shows what the resulting durations let you compute: earliest and latest dates, float, the critical path, and how much confidence the answer deserves.
The PERT formula
A single duration estimate hides how confident you are in it. Someone who says "six days" may mean "six, give or take a morning" or "six if nothing goes wrong, three weeks if it does". The two situations call for different decisions, and the single number erases the difference.
PERT, the Program Evaluation and Review Technique, replaces one estimate with three:
- O, optimistic: everything goes right, nothing waits on anyone
- M, most likely: the realistic case, the one you would bet on
- P, pessimistic: things go wrong, but nothing catastrophic happens
The expected duration is their weighted average:
tE = (O + 4M + P) / 6
Why four, and why six
The most likely value carries four times the weight of each extreme. The divisor is six because the weights sum to six: one for O, four for M, one for P.
The consequence is that the result is not the plain average of the three numbers. It leans towards the realistic case while still letting the tails move it. That asymmetry is the whole point: a task with a long pessimistic tail comes out longer than its most likely value, which is what actually happens on projects, and what single-point estimating systematically misses.
Standard deviation and variance
The same three numbers also tell you how much to trust the result:
σ = (P − O) / 6
variance = σ²
The spread between optimistic and pessimistic is divided by six because a normal distribution spans roughly six standard deviations between its practical extremes.
A wide spread does not mean a longer task. It means a task you know less about. That distinction should change what you do, and usually does not: teams pad the duration when they should be reducing the uncertainty, by prototyping, by asking the supplier, by cutting the scope of the unknown part.
Keep the variances. You will need them at the end to say how much confidence the project date deserves.
PERT formula: a worked example
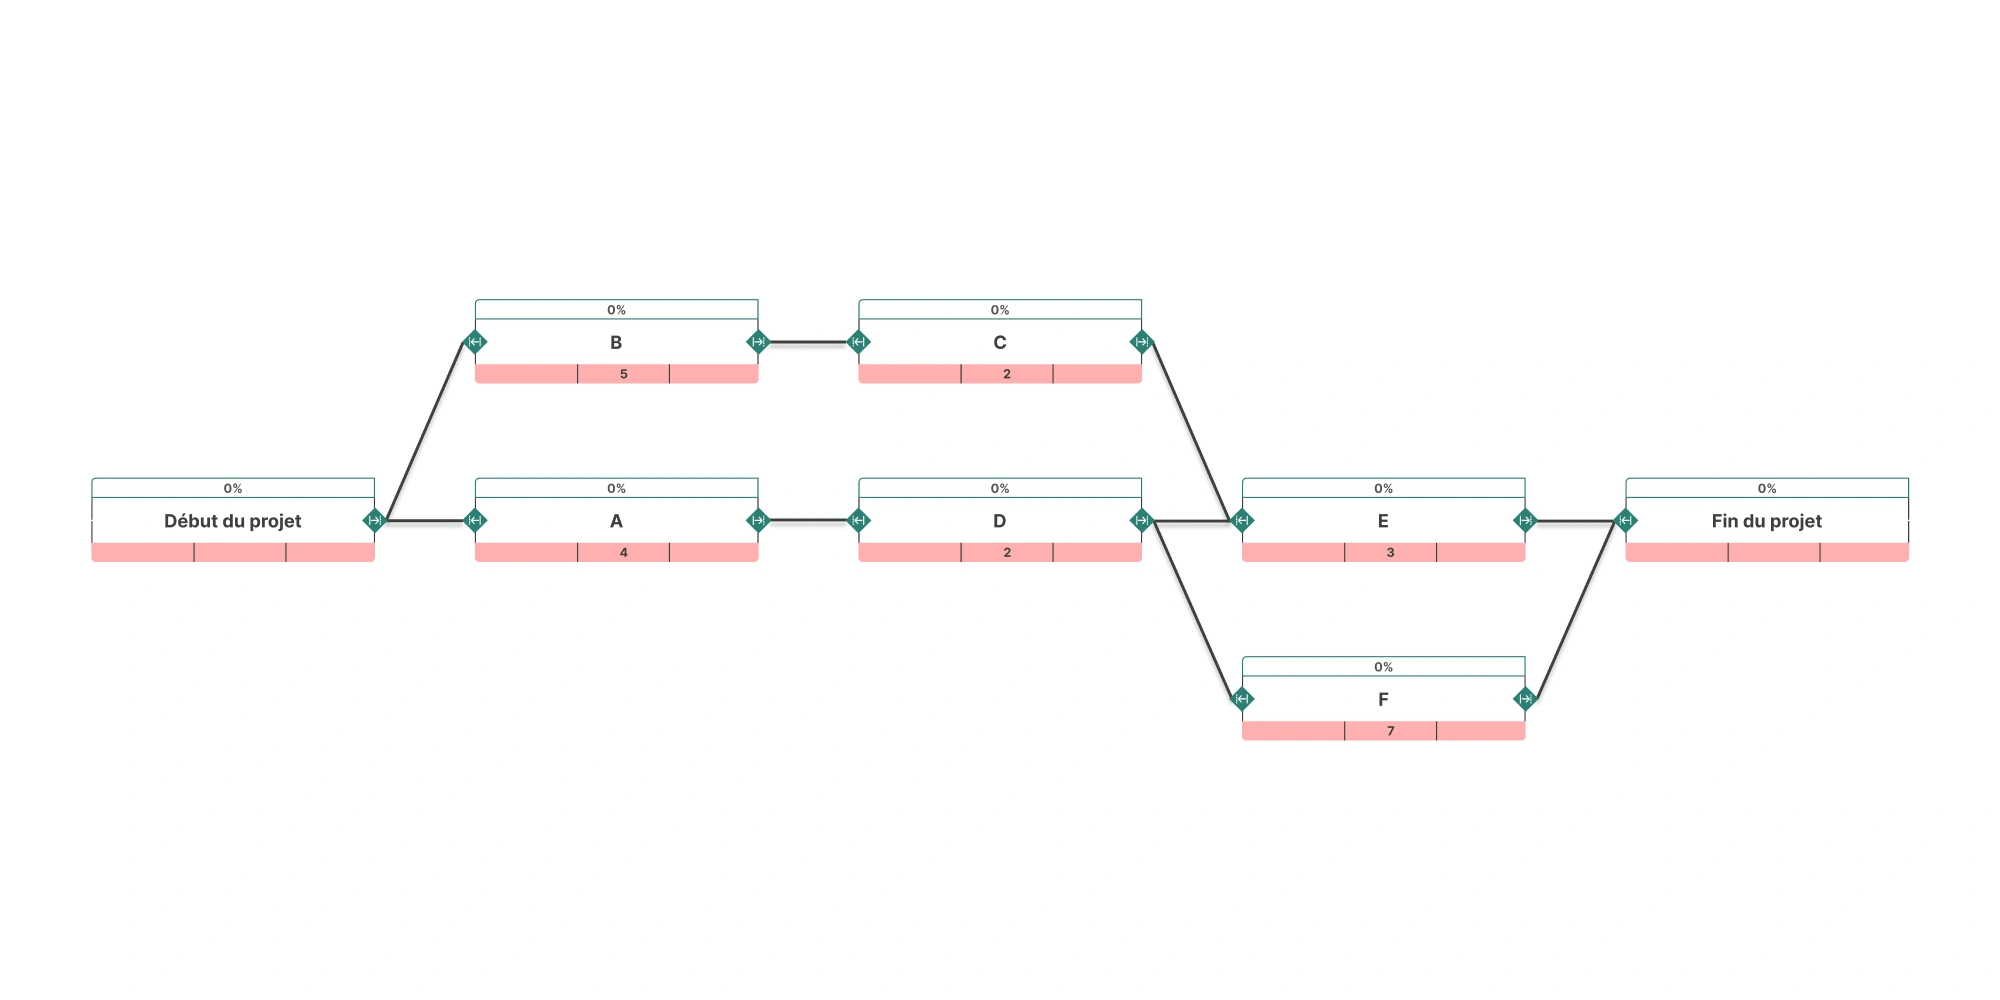
Four tasks. A must finish before B and C can start. Both B and C must finish before D can start.
| Task | O | M | P | tE = (O + 4M + P) / 6 | σ = (P − O) / 6 | σ² |
|---|---|---|---|---|---|---|
| A | 2 | 3 | 10 | (2 + 12 + 10) / 6 = 4 | 1.33 | 1.78 |
| B | 3 | 5 | 13 | (3 + 20 + 13) / 6 = 6 | 1.67 | 2.78 |
| C | 1 | 2 | 9 | (1 + 8 + 9) / 6 = 3 | 1.33 | 1.78 |
| D | 4 | 6 | 14 | (4 + 24 + 14) / 6 = 7 | 1.67 | 2.78 |
Task A is worth a second look. Its most likely value is 3 days, but its pessimistic case is 10. The formula returns 4, not 3. Anyone who had written "3 days" in the plan was already a day short before the project began.
The forward pass: earliest dates
Working left to right through the network, compute for each activity:
- ES, earliest start, equals the largest EF among its predecessors
- EF, earliest finish, equals ES + tE
The first activity starts at 0. The key word is largest: an activity with several predecessors waits for the slowest of them. This is why convergence points concentrate risk, and why a task that looked harmless can hold up everything downstream.
On the example: A runs 0 to 4. B then runs 4 to 10, C runs 4 to 7. D waits for the later of the two, so it starts at 10 and finishes at 17.
The EF of the last activity is the minimum project duration: 17 days.
The backward pass: latest dates
Working right to left from that end date:
- LF, latest finish, equals the smallest LS among its successors
- LS, latest start, equals LF − tE
Here the key word is smallest: an activity has to finish early enough for its most urgent successor, not its most relaxed one.
Float: total and free
Two measures come out of the two passes, and they answer different questions.
Total float = LS − ES, equivalently LF − EF
Free float = smallest ES among successors − EF
Total float is how long an activity can slip without moving the project end date. Free float is how long it can slip without moving any successor.
The full table for the example:
| Task | ES | EF | LS | LF | Total float | Free float |
|---|---|---|---|---|---|---|
| A | 0 | 4 | 0 | 4 | 0 | 0 |
| B | 4 | 10 | 4 | 10 | 0 | 0 |
| C | 4 | 7 | 7 | 10 | 3 | 3 |
| D | 10 | 17 | 10 | 17 | 0 | 0 |
The difference between the two floats matters in practice. An activity with 5 days of total float and 0 days of free float can absorb a delay without endangering the project, but the next task will be squeezed immediately. A manager looking only at total float will approve that delay and be surprised by the downstream complaint.
Reading off the critical path
Activities whose total float is zero form the critical path. Here that is A to B to D, 4 + 6 + 7 = 17 days. C has three days of room and is not on it.
There is no judgement involved: the path falls out of the arithmetic. What it means for how you run the project, and the traps in reading it, are covered in what the critical path is and what it is not.
How confident is the 17 days?
This is the part the PERT formula was designed for, and the part most often dropped. The variances you kept earlier now do their work.
Add the variances of the activities on the critical path, then take the square root:
σproject = √(σ²A + σ²B + σ²D) = √(1.78 + 2.78 + 2.78) = √7.33 ≈ 2.7 days
Variances add, standard deviations do not. That is why you sum the squares and take the root at the end.
Treating the total as normally distributed, which the central limit theorem makes reasonable once several tasks are involved:
- about 68 % chance of finishing between 14 and 20 days, that is 17 ± 2.7
- about 95 % chance of finishing between 12 and 22 days, that is 17 ± 1.96 × 2.7
Those two lines change a conversation. "Seventeen days" invites a yes or no. "Seventeen days, and I would not commit below fourteen without cutting scope" invites a decision. Note also that the interval is built only from the critical path: a near-critical chain with wide estimates can overtake it and make the real spread worse than the number suggests.
Why this has to be recomputed
Recalculating after every change is part of the method, not an extra step. The PMI standards treat schedule control as a continuous activity, not a one-off exercise.
Every number on this page depends on the durations and the dependency structure. Change one estimate and the float distribution changes. Change enough of them and the critical path jumps to a different chain, which invalidates the confidence interval too, since it was computed on the old path.
Doing this by hand once is instructive. Doing it by hand every week is not sustainable, which is why it is the part of scheduling worth automating, and why a Gantt chart maintained manually drifts away from reality within weeks. A tool that reruns both passes on every change keeps the float and the critical path in step with the plan.