
Gantt Chart Software: A Schedule Built on Real Structure
Orchesia generates your Gantt chart from your WBS and dependencies. Clear scope, identified critical path, timelines you can defend.
Why use planning software to build a Gantt chart?
Because a Gantt tracks the project — it isn't meant to build a schedule from a blank page.
Because without software, your Gantt chart is just a task list
Without upfront structuring (WBS), the chart reduces to bars entered by hand. Scope stays vague and the schedule is fragile from day one.
Because dependency arrows quickly become unreadable
Without an upstream dependency mapping tool (PERT), you position them by hand in a chart that becomes unreadable within moments.
Because the Gantt shouldn't be built by the project manager alone
Without collaborative planning software, it's developed in isolation and doesn't reflect field constraints. It looks reassuring, but it's bypassed as soon as launch begins.
Every tool draws a Gantt chart. One builds it.
In late 2025 we tested 50 project management tools. Nearly all display a Gantt chart. One generates it from a breakdown and a dependency network.
The Gantt shows up, but you type everything first
You place bars by hand, one at a time, on an empty calendar. In ClickUp, dependencies do not even shift dates: they flag a blocker without recomputing anything.
Excel draws a Gantt that knows nothing about the project
The bars are coloured cells. No links, no recalculation, no critical path. The file ages the moment a date changes.
MS Project computes well, but assumes the project is already scoped
Dependencies, float and critical path are solid. You still have to arrive with the structure in your head, and it is not collaborative.
The meeting Gantt: neat, and wrong within a week
It serves the kickoff. Four weeks later nobody opens it, and it gets rebuilt from scratch for the next meeting.
The Gantt chart is not the problem. When you open it is: a tracking tool used as a construction tool.
Getting a Gantt chart without drawing one
The schedule is an output. It follows from the breakdown and the dependencies, and is recomputed when either moves.
Gantt within a structured upfront planning approach
In Orchesia, the Gantt chart isn't a starting point. It's generated from a WBS and PERT already built. The schedule reflects project reality from day one.
Your Gantt is generated, not entered by hand
Once the WBS and dependencies are defined in the PERT, Orchesia automatically generates the Gantt chart. You don't have to enter dates one by one. The schedule flows from the structure.
Dependencies are respected automatically
Each task is positioned considering constraints defined in the PERT. The critical path is visible. You know exactly what can slip without impact and what is blocking.
AI working on your project
Describe your project in one sentence: AI generates the WBS, predicts the tasks and proposes the dependencies. You review and adjust in one click. You keep control — AI just speeds it up.
Adjust without rebuilding everything
When the project evolves, you modify the structure or dependencies. The Gantt recalculates automatically. No more manual rescheduling, no more ghost schedules.
A well-built Gantt chart is a schedule the team understands, the client believes, and you can defend.
A third of SMEs use no project management software
And among those that do, the majority want to switch.
- 35%
of SMEs use nothing beyond spreadsheets, email or paper
Capterra 2018, 753 respondents, 250 in SMEs - 55%
of employees equipped with project software are looking to change tool
Capterra 2018 - 2 to 15%
of projects consistently apply a research-backed method
PMI, Pulse of the Profession 2018
The Gantt chart: before and after
A hand-drawn Gantt
Neat for kickoff, wrong by week two.
- Dates are set before the dependencies are known
- One slip means repositioning every bar
- The critical path appears nowhere
- After four weeks nobody opens it
- It gets rebuilt from scratch for the next meeting
A Gantt generated from the structure
The schedule follows the project, not the other way round.
- Dates follow from durations and sequencing
- A slip propagates to linked tasks automatically
- The critical path is traced and kept current
- A baseline lets you compare against what was committed
- The schedule stays true without being rebuilt
Who tracks with a Gantt chart in Orchesia
The chart is for tracking. It only becomes reliable if something feeds it.

Project managers in SMEs
To stop rebuilding the schedule before every meeting, without moving to a tool that needs training.

Engineering firms
To hold a schedule you can defend with a client, float and critical path visible.

Agencies and vendors
To show a client the real effect of a late approval on the delivery date.

Teams leaving spreadsheets
To regain the date and dependency calculations a spreadsheet does not do.
A reliable Gantt isn't typed in.
It's generated from a solid structure.
See Orchesia in actionFrequently asked questions
PERT models dependencies between tasks and identifies the critical path. Gantt charts schedule tasks over time with dates. In Orchesia, you build the PERT first, then the Gantt generates automatically.
Yes. Without a WBS, the Gantt is a task list without structure. Durations are estimated by intuition and the schedule doesn't survive the first change.
Yes. The schedule is co-built with teams. Everyone sees the same Gantt in real time, with the same dependencies and milestones.
If the WBS and PERT are already built, the Gantt is generated in seconds. You can also start from scratch and let AI generate an initial structure from one sentence.
Yes, but Excel doesn't manage dependencies automatically, doesn't recalculate the schedule when a task slips, and doesn't support real-time collaboration. As soon as the project evolves, the file becomes a problem.
Simple pricing, no surprises
All the tools to structure and run your projects. 30-day free trial.
per user, billed monthly
View pricing30-day free trial · No commitment · Cancel anytime
What's included
- Access to all features
- Free updates
- Document storage
- Real-time collaboration
- PDF export
 AI credits
Further reading
The methods behind the tool, explained in detail.
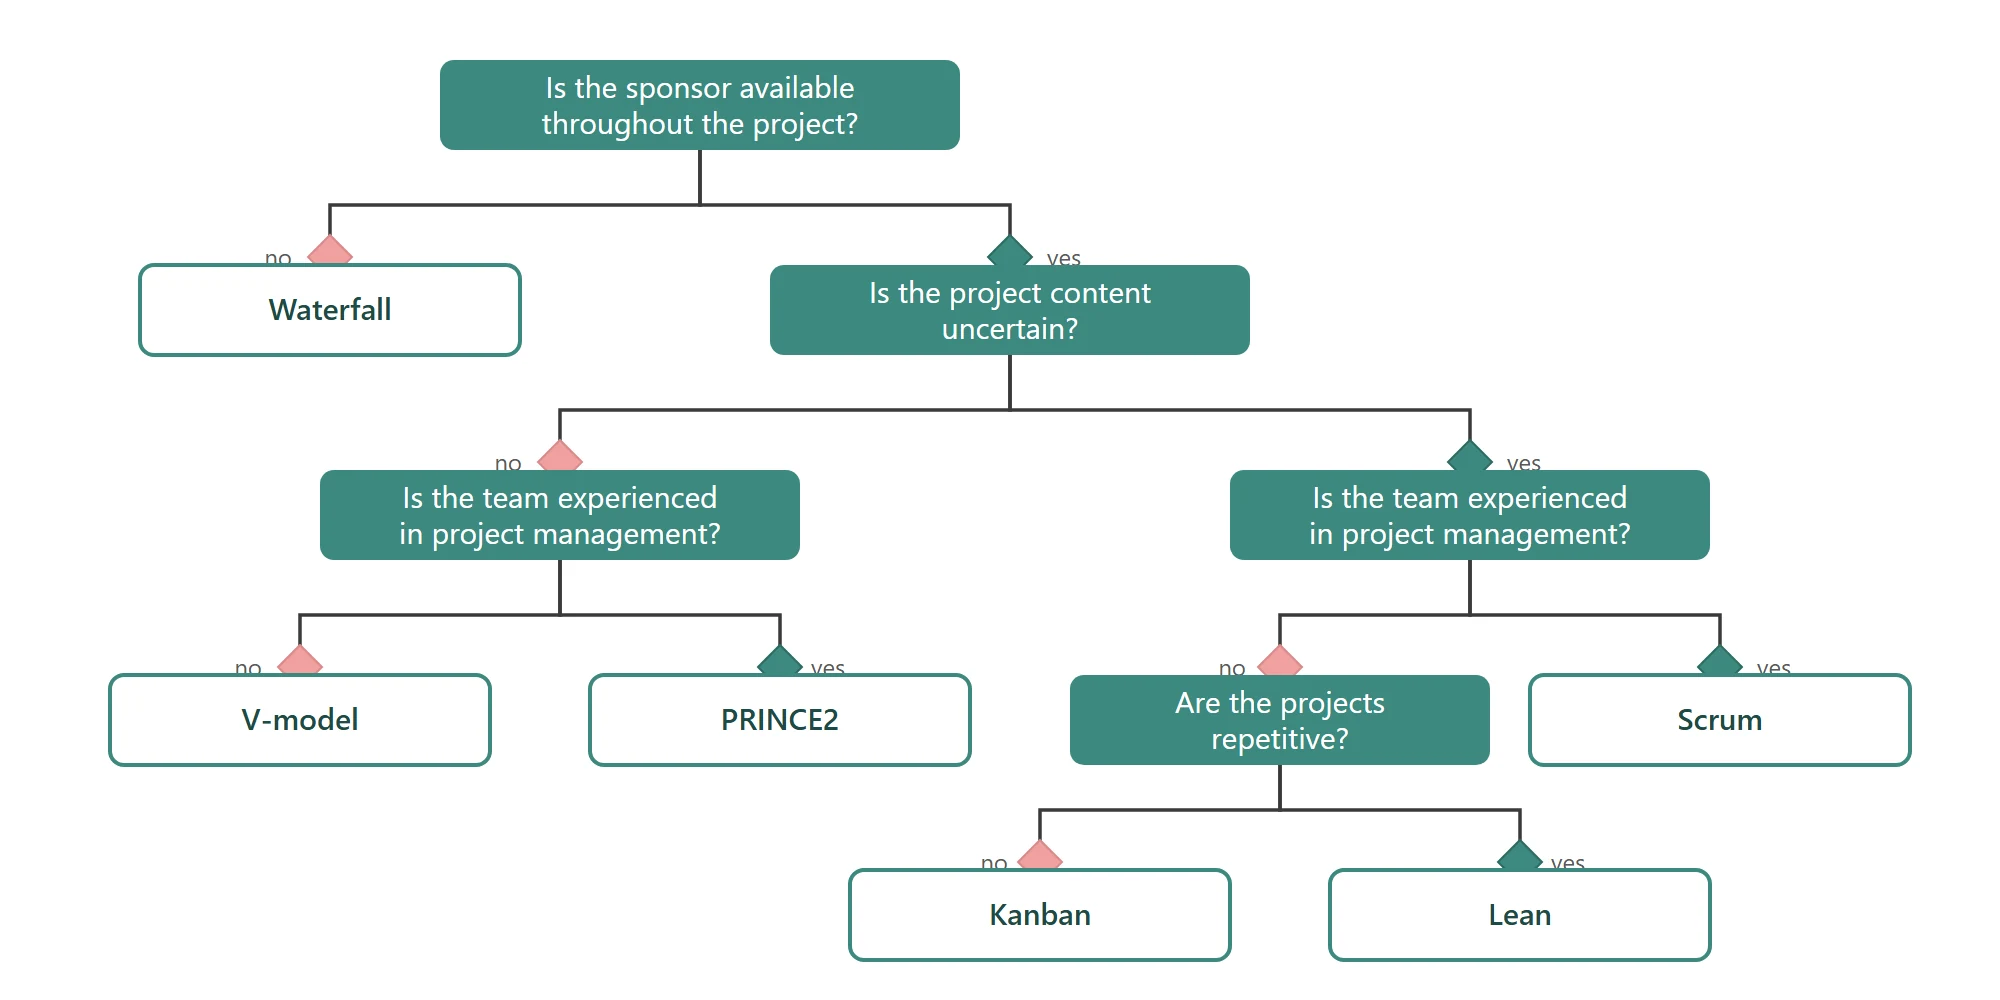 Project management methodologies: agile and traditional approachesWaterfall, V-model, PRINCE2, Scrum, Kanban, Lean: what each method fixes at the start, what it leaves open, and the situations where it holds.
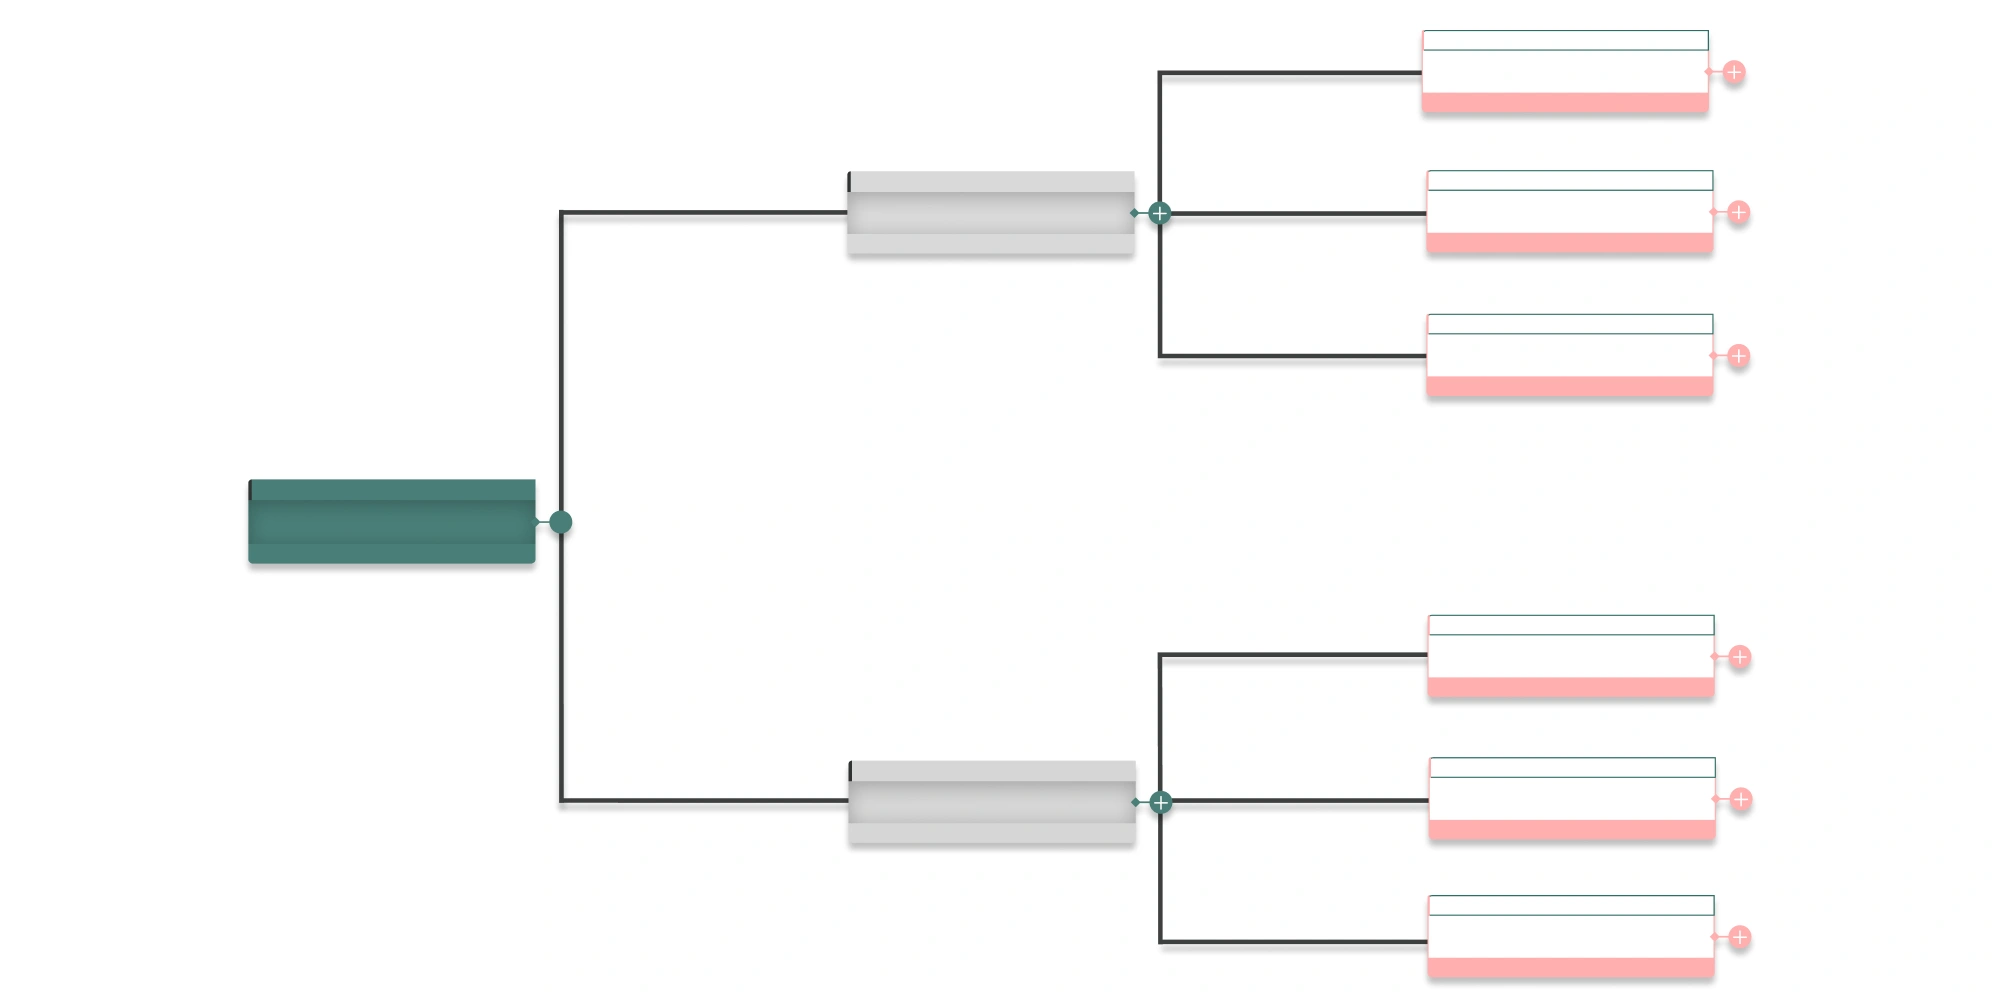 What is a Work Breakdown Structure (WBS)?A WBS breaks a project into deliverables and work packages. Definition, the 100% rule, decomposition levels and how it differs from a task list.
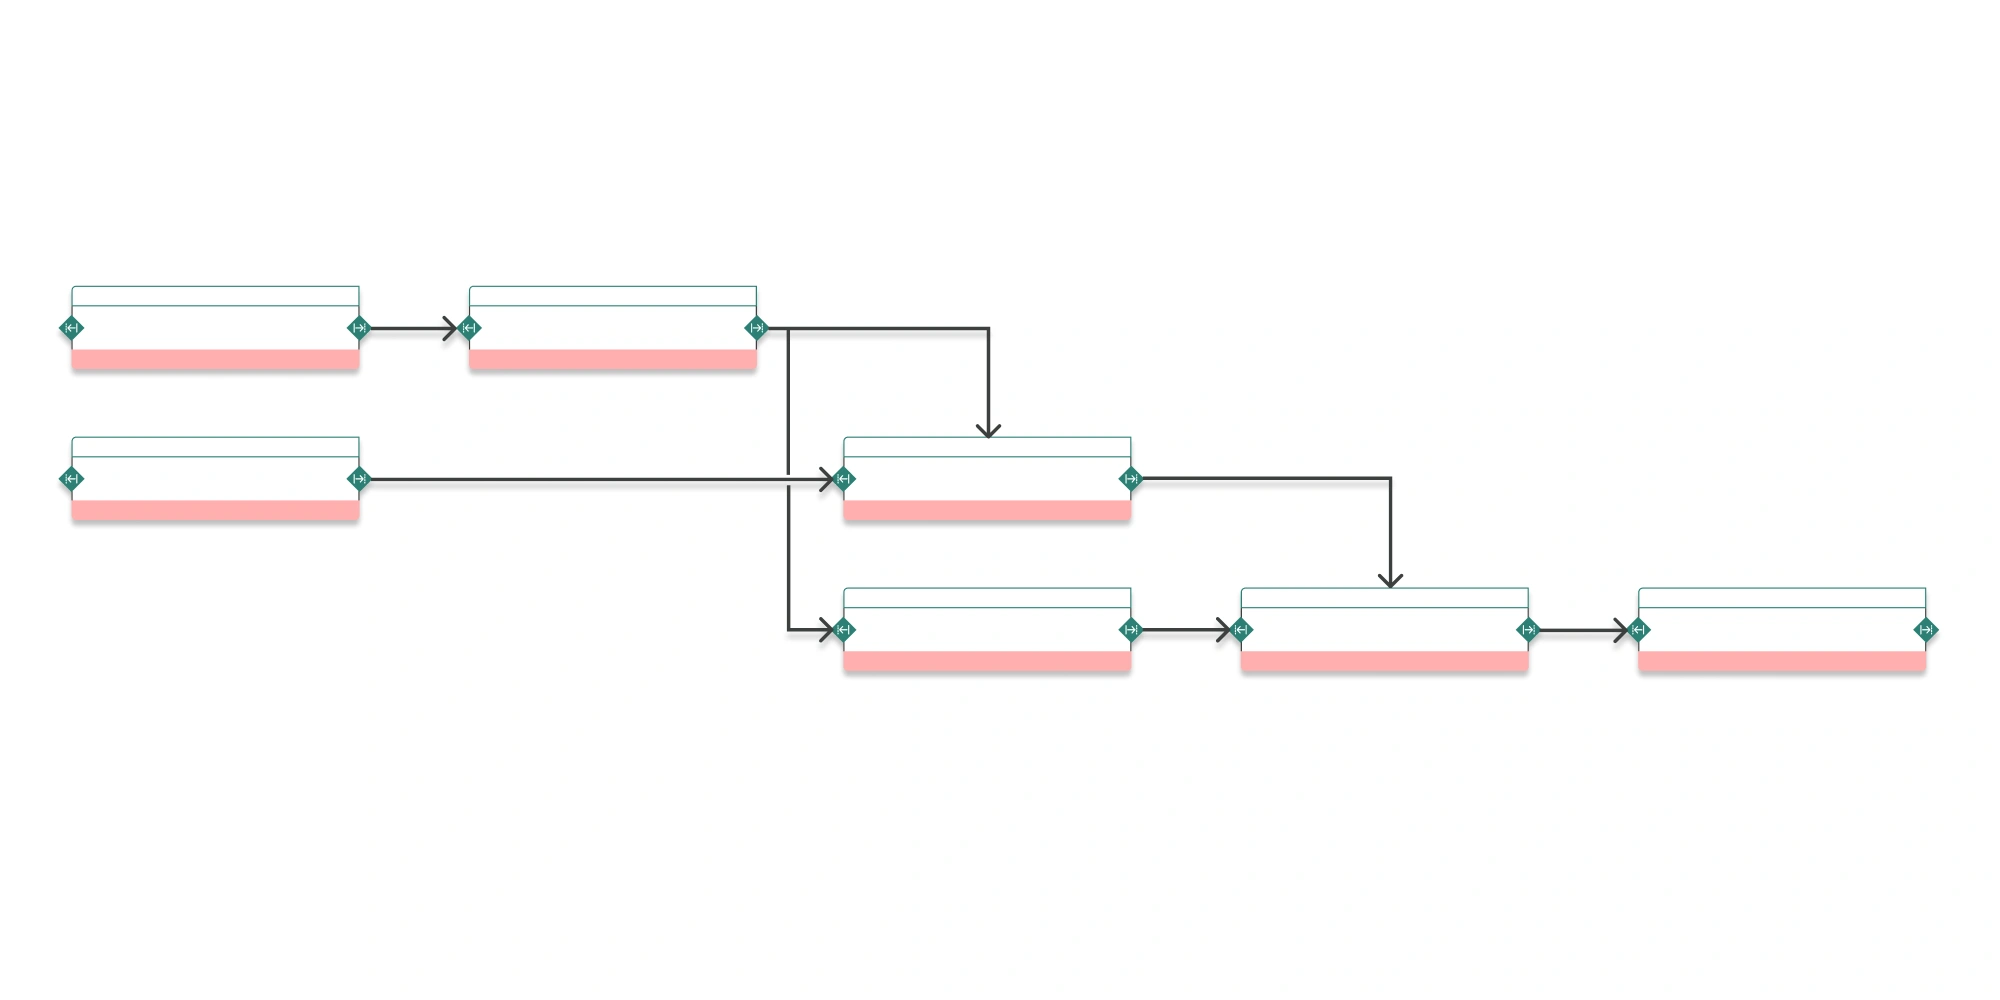 What is a PERT chart? Definition and role in project managementA PERT chart models the dependencies between tasks and reveals the sequence that actually drives the end date. Definition, notation and how it differs from a Gantt chart.
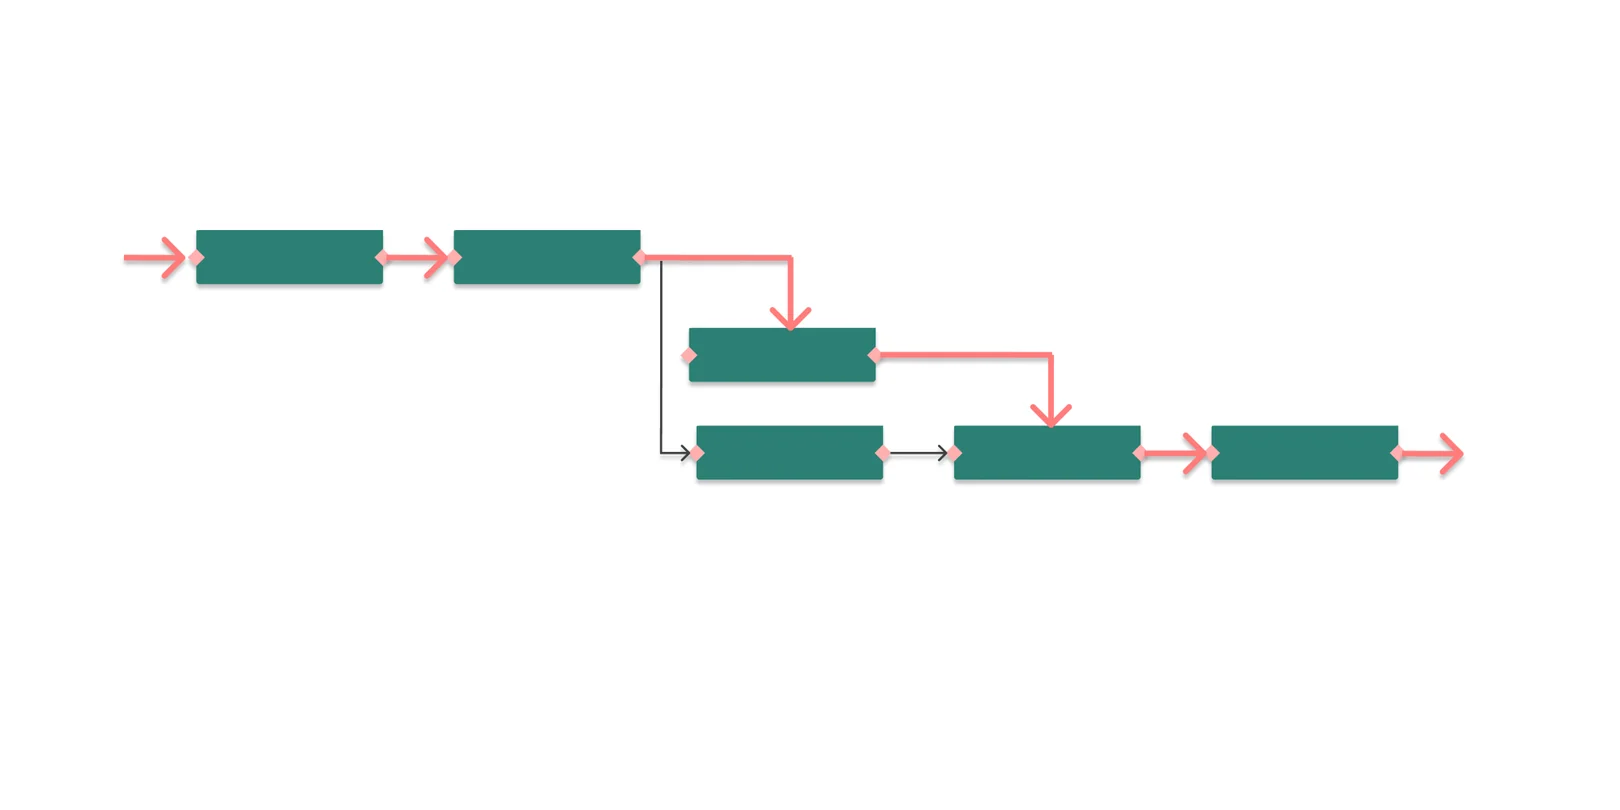 What is the critical path in project management?The critical path is the longest chain of dependent tasks in a project. It sets the minimum duration — and any delay on it moves the end date.
Your schedule deserves better than a spreadsheet you constantly reschedule.
Build your Gantt from a solid structure. Deadlines met, automatic adjustments, zero manual rescheduling. 30-day free trial, no credit card required.