
PERT chart Excel template: the critical path calculated, not guessed
You say what blocks each task; the workbook works out the dates, the latest finish, the float of every task and the critical path. Working days and public holidays included, no macros.
The idea: a PERT chart is not about drawing boxes
It is about knowing which tasks drive the end date.
The end date depends on a single chain of tasks
Out of ten tasks, only six decide the delivery date: the ones that follow each other with no float at all. The other four can slip by several days without changing anything. Until that chain is identified, everything is watched with the same anxiety, and the one that matters is missed.
A task often waits on several things at once
Loading the catalogue waits on the product pages, on the site being built and on the photos. The latest of the three sets its start, and which one that is changes as soon as another runs late. A calculation that follows a single predecessor gives a wrong date without saying so.
Float is not free time
Saying a task has eight days of float means it can slip by eight days without pushing the end of the project. Not that it can start eight days later with no consequence: the float is shared with the tasks that follow it on the same branch.
What the workbook contains
Four tabs, no macros, everything visible and editable. The calculation cells are locked so a formula does not get wiped by accident; the input cells stay free.
A chart that arranges itself
Each task lands in a stage column, always to the right of the ones blocking it. Every box carries what a PERT node shows: the id and the name, the tasks blocking it, the float, then the start, the duration and the end. Tasks on the critical path turn red, and a band at the top gives the project start and end, its duration and the number of critical tasks.
Up to three blocking tasks per row
For each task, pick from a drop-down list what has to be finished before it starts. Its start becomes the latest of the “end of the blocking task plus one day”, lag included. A lag covers a wait after the task, such as a bank approval; a fixed start covers a date that cannot be moved earlier, such as a photographer coming in.
Latest finish, float and critical path
After the earliest dates, the workbook walks the chain backwards from the end of the project: for each task, the date it can finish on without pushing anything. The gap between the two gives its float in days. A float of zero puts the task on the critical path, and the row turns red.
Dates in working days, holidays removed
One setting decides whether durations count weekends, and a list of public holidays is taken out of the calculation. Dates, float and the total duration of the project all follow that setting. A Check column flags whatever breaks the calculation: missing duration, unknown blocking task, duplicate link, fixed start overtaken.
A useful task network is not a complete one. It is one where you can see, in red, what cannot slip.
How to use it
Five steps. The third one makes the chart: say what blocks each task, instead of typing dates.
Dependencies rank above poor execution
Among the failure causes recorded by PMI, mis-identified sequencing weighs more than procrastination or lack of resources.
- 26%
of failed projects cite poorly identified resource dependencies
PMI, Pulse of the Profession 2018, 4,455 practitioners - 12%
cite poorly identified task dependencies
PMI, Pulse of the Profession 2018 - 3rd of 15
organising tasks, among the main challenges reported by French SMEs
Capterra 2018, 753 respondents
An undeclared dependency only shows up when it blocks. By then it cannot be solved, only absorbed.
Where this workbook stops
The workbook calculates correctly, as long as the network stays a human size and the plan does not move too much. Four things escape it, and none of them is fixed by one more formula.
One duration per task
The original PERT method weights three estimates, optimistic, likely and pessimistic. This workbook takes one: the end date it shows is a date, not a probability. If your durations are shaky, the float it shows is just as shaky.
The calculation ignores who does what
Two critical tasks running in parallel can land on the same person, and the workbook schedules them as if that person could split in two. It knows nothing about time off or about anyone's workload: the date is right on paper, not necessarily in the calendars.
The network describes the plan, not the reality
When a task runs late, you have to correct its duration by hand to watch the critical path recalculate. Nothing keeps the previous version, and nothing tells you how far the project has drifted since the first plan.
Boxes, no arrows
A spreadsheet cannot draw links that follow the data. So each box names the tasks blocking it, and the chart shows eight stages and six tasks per stage at most. Beyond that the calculation stays correct in the Tasks tab, but the network no longer reads at a glance.
None of these four points is a flaw in the template. They are the limits of a network kept apart from the project it describes.
The spreadsheet, and then what
With the workbook
The right tool to lay out a first network and spot what cannot slip.
- Three blocking tasks per row at most
- Boxes with no arrows between the tasks
- Durations corrected by hand at every delay
- A loop between two tasks breaks the calculation
- Nothing connects the network to people and their workload
With Orchesia
The same logic, held by the tool rather than by formulas.
- As many blocking tasks as needed, linked in two clicks
- The links drawn on the diagram, the critical path in red
- Dates and critical path recalculated at every change
- Loops and redundant links refused as you create them
- Every task has its members, and each person's workload reads by period
Doing it in Excel?
To lay out a first task network and show it in a meeting, a spreadsheet does the job well. The file is sent immediately after you confirm, with no email to wait for.
What you get
- 100 KB .xlsx workbook, no macros, works in Excel 2019 and Microsoft 365, LibreOffice and Google Sheets
- Four tabs: how to use, settings, tasks, PERT chart
- 50 tasks, three blocking tasks per row, editable public holidays
- A worked example, opening an online shop in ten tasks
Frequently asked questions
Yes, and with nothing asked beyond your email address, which is used to send you the file. You are only subscribed to the newsletter if you tick the box for it, and the file is sent the same way either way.
It is a project drawn as a network: each task is linked to the ones that must be finished before it starts. From those links and the durations come the earliest and latest dates of every task, its float, and the critical path, meaning the run of tasks with no float that sets the end date.
A Gantt chart puts the tasks on a calendar: it shows when each task happens. A PERT chart shows the order they run in and which ones drive the end date. The two work together: you build the network with PERT, then follow the calendar with the Gantt chart.
In two passes. The first starts at the beginning of the project and calculates the earliest start and finish of every task, taking the latest of its blocking tasks. The second starts at the end of the project and walks back up the network to calculate the latest finish. The float is the gap between the two, in working days if the setting is on Yes. A float of zero puts the task on the critical path.
Because most teams plan with a single duration per task, and a weighted average of three estimates gives an appearance of precision the estimates themselves do not have. If a duration is uncertain, the most useful thing to look at is the float of that task: a critical task with a shaky duration is the real risk in the plan.
That you set a start date, but the tasks blocking that one finish later. The workbook then keeps the calculated date, the later one, and flags it in the Check column. You either pull the blocking tasks forward, or accept the new date.
The file is a plain .xlsx with no macros. It opens in Excel 2019, Microsoft 365, LibreOffice Calc and Google Sheets. On Excel 2016 and older, the dates are still calculated but the latest finish and the float show an error, because they rely on a function introduced with Excel 2019.
Only the ones carrying a formula or a header, so a paste does not wipe them. Every input cell stays free: settings, public holidays, and the task, duration, blocked by, lag and fixed start columns. If you want to change a formula, the protection comes off from the Review tab with the password “orchesia”.
Fifty tasks, with three blocking tasks each at most. The chart shows eight stages and six tasks per stage; beyond that the tasks are still calculated in the Tasks tab and a message says how many do not fit in the drawing.
Further reading
The methods behind the tool, explained in detail.
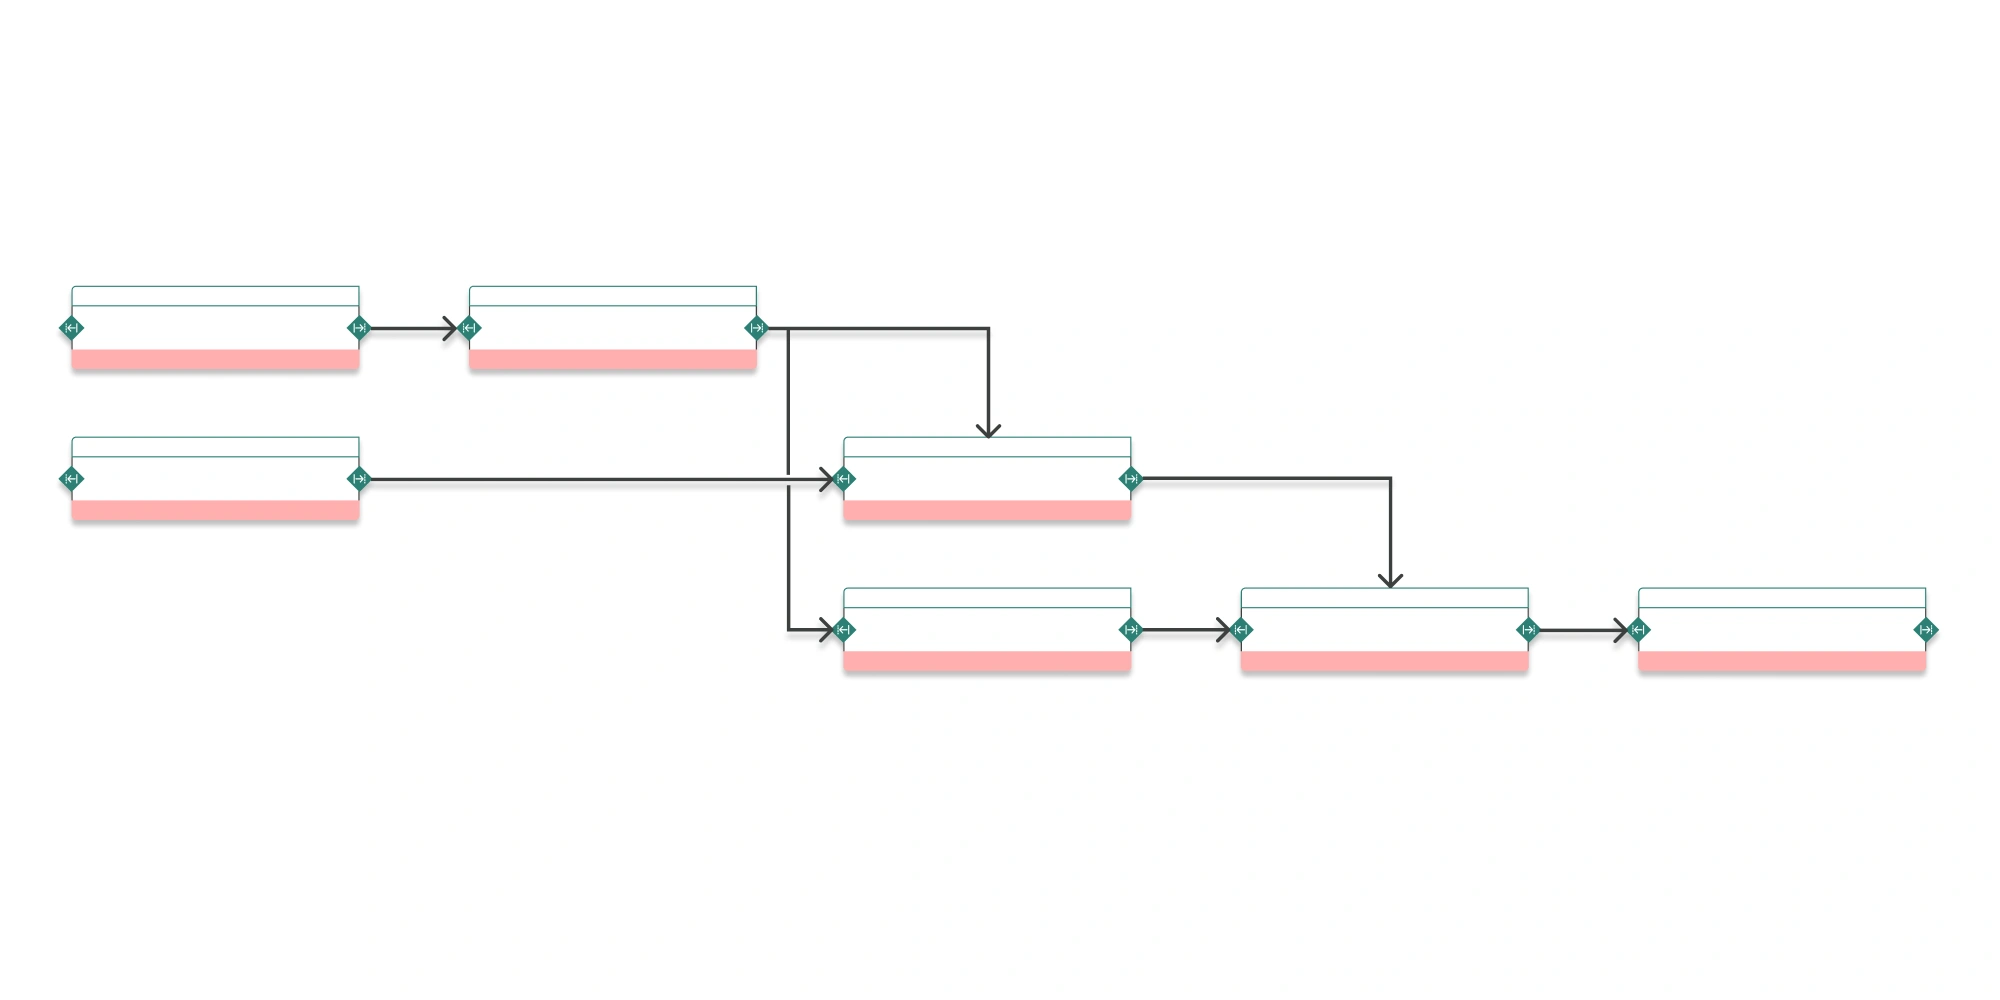 What is a PERT chart? Definition and role in project managementA PERT chart models the dependencies between tasks and reveals the sequence that actually drives the end date. Definition, notation and how it differs from a Gantt chart.
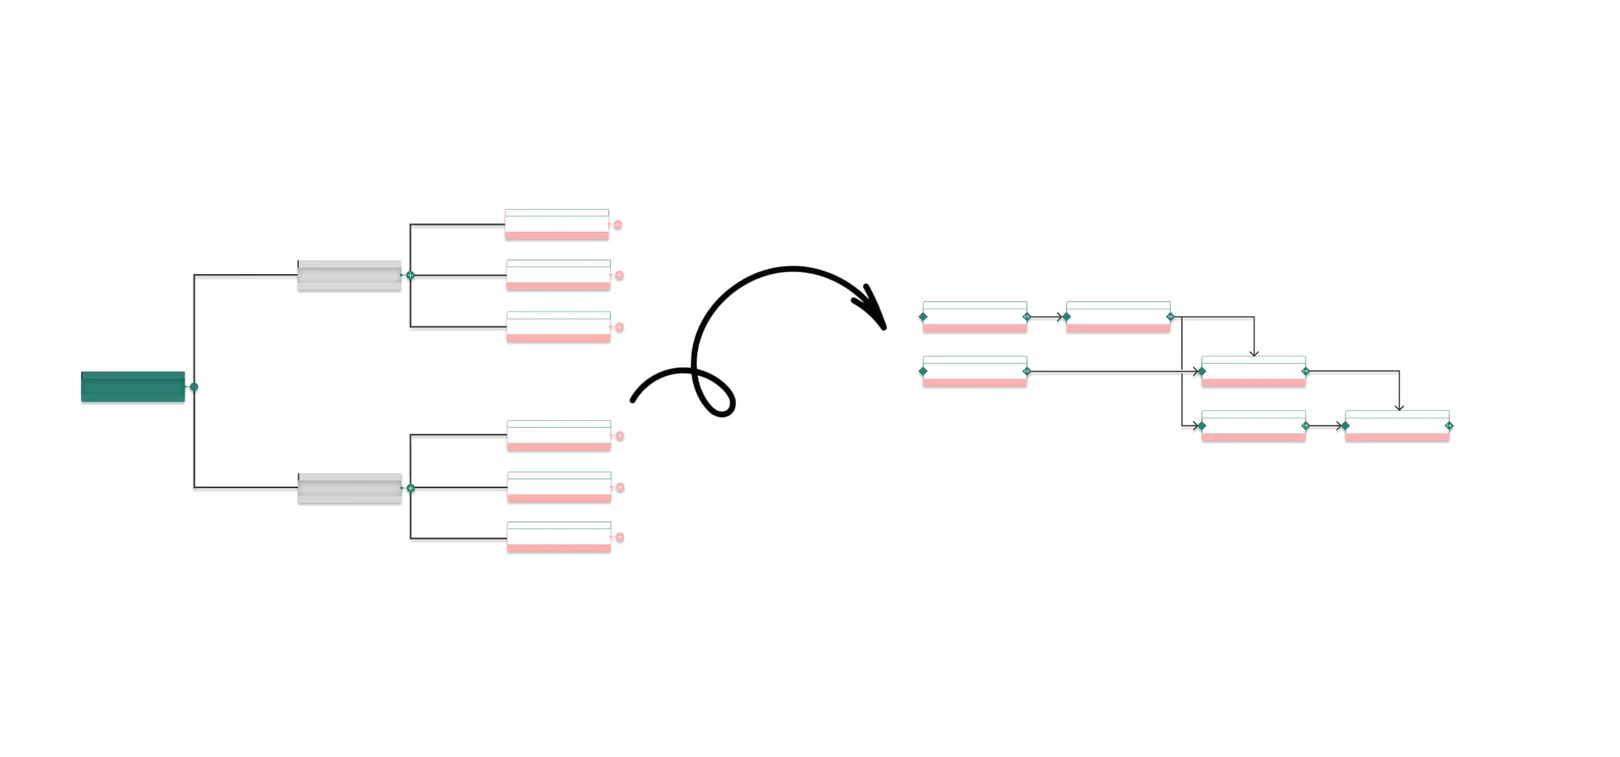 How to build a PERT chart, step by stepFrom a list of work packages to a dependency network you can compute: the method, the notation and the errors that make a network useless.
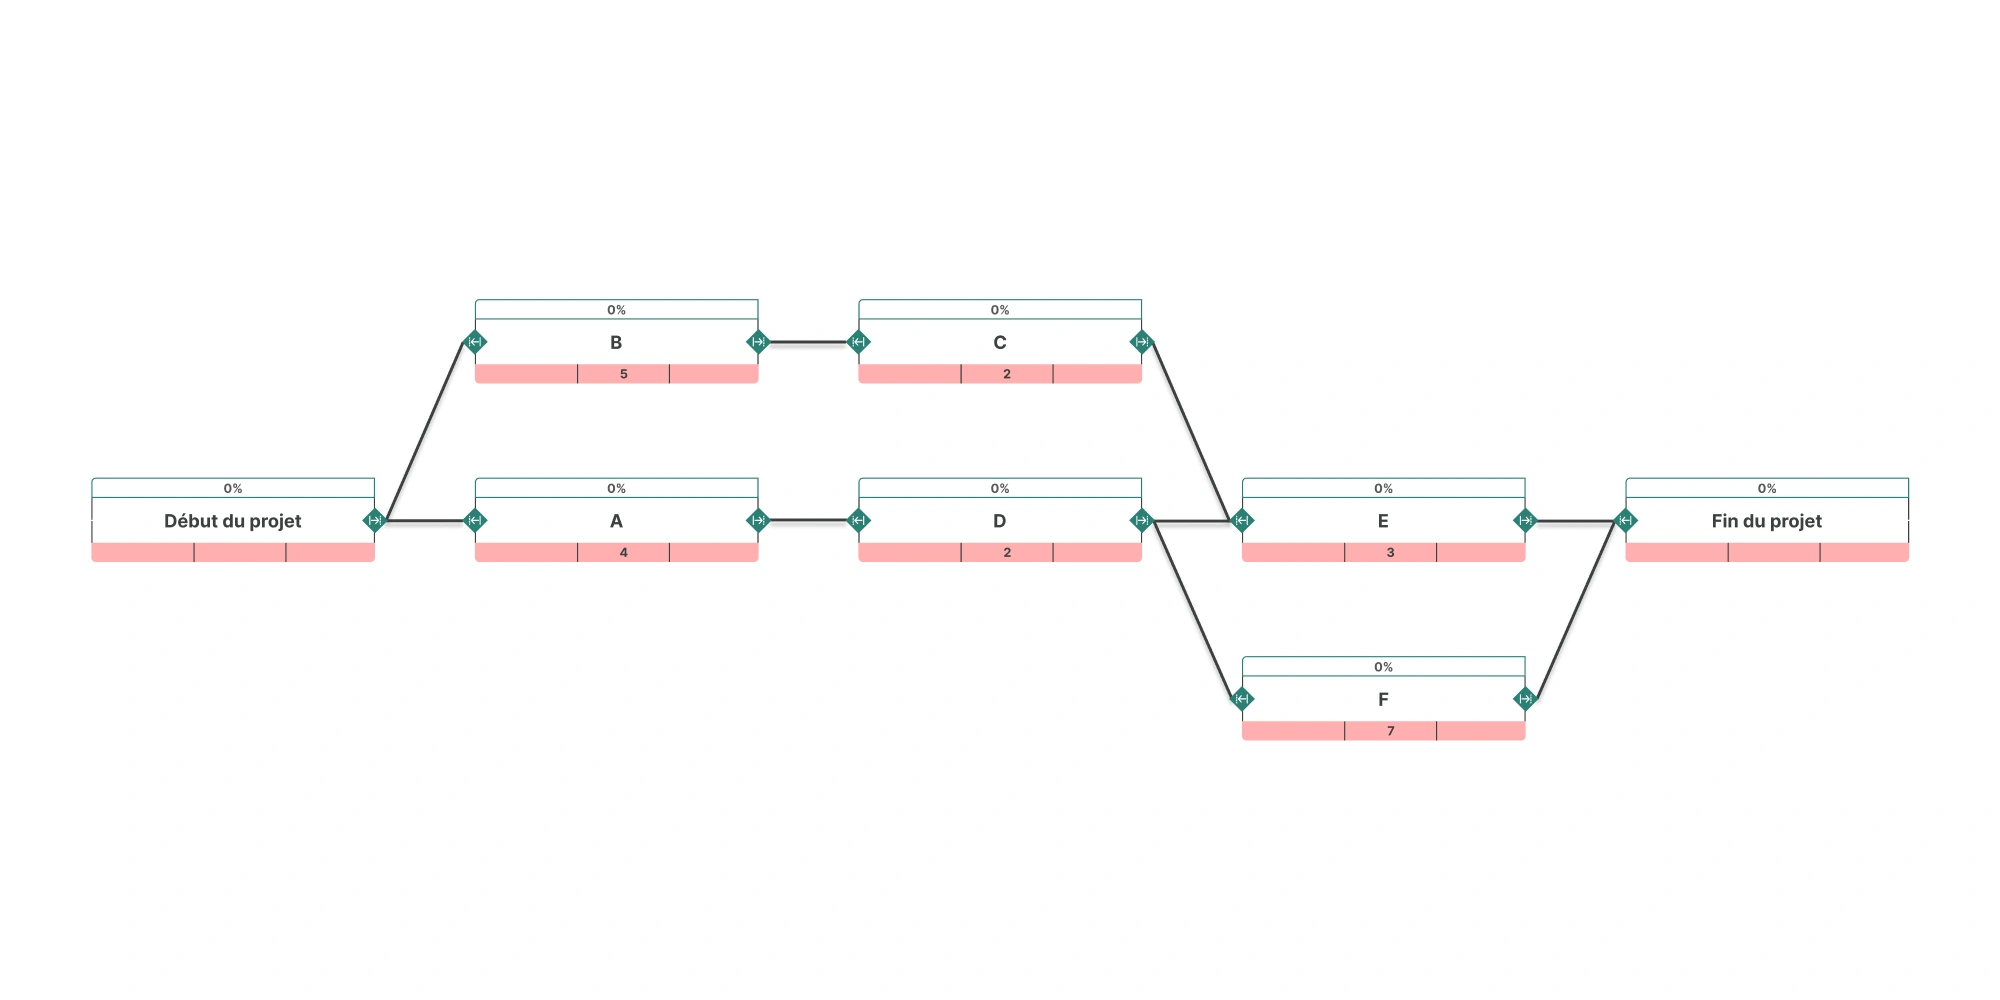 PERT formula: expected duration, float and the critical pathThe three-point estimate, the forward and backward passes, total and free float: the arithmetic behind a schedule you can defend.
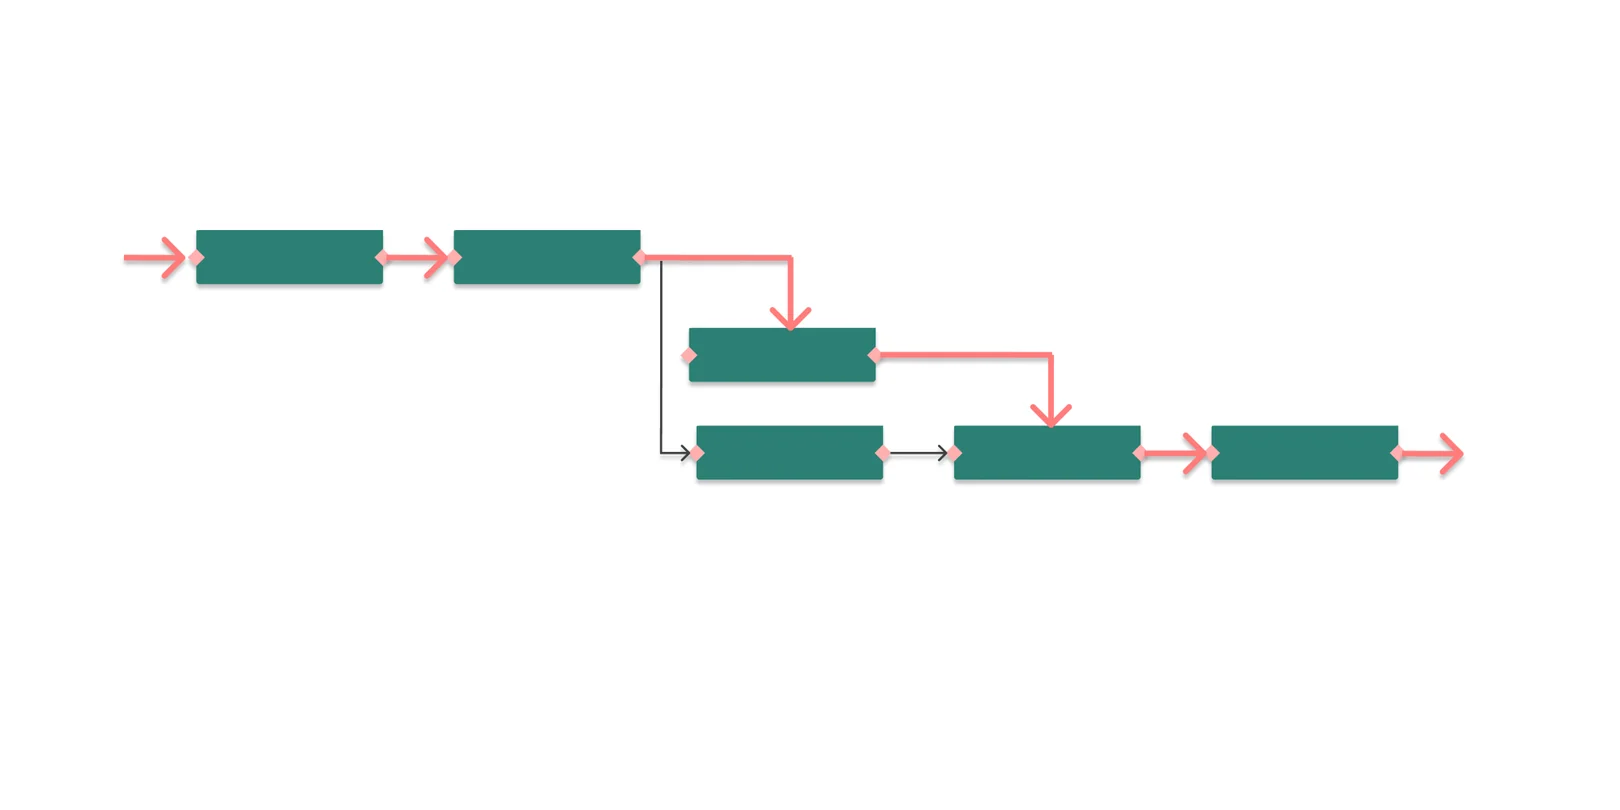 What is the critical path in project management?The critical path is the longest chain of dependent tasks in a project. It sets the minimum duration — and any delay on it moves the end date.
The workbook finds the critical path. The software keeps it up to date.
Links drawn in two clicks, as many blocking tasks as you need, and a critical path recalculated at every change. Free 30-day trial, no credit card.