A PERT chart is a network of tasks connected by dependency relationships. Building one is mechanical once you have the right input — and nearly impossible from a blank page, which is why so many attempts stall.
Step 0 — Start from the WBS
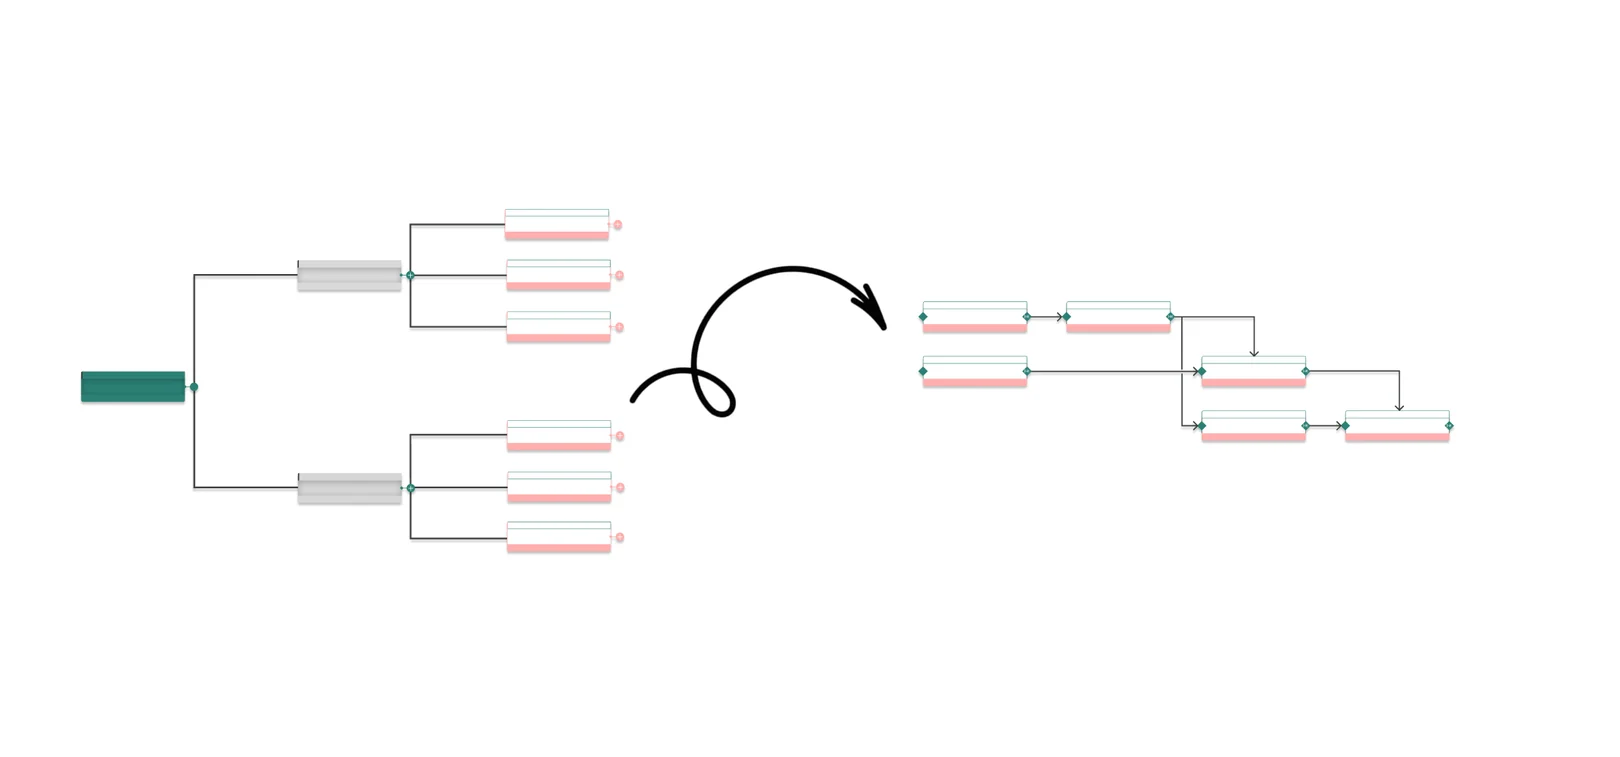
The input to a network is the set of work packages from your work breakdown structure. Trying to build a network directly from memory produces two predictable failures: tasks nobody thought of are missing, and the level of granularity is inconsistent.
If you do not have a WBS, build that first. It takes less time than debugging a network built on an incomplete list.
Step 1 — List the activities at a single level of granularity
Mixing granularity is the most common structural error. A network where one node is "build the API" and another is "send the kick-off invite" cannot be reasoned about: the float numbers are meaningless because the nodes are not comparable.
Pick a level — usually the work package — and stay on it.
Step 2 — Define the dependencies
For each activity, ask two questions:
- What must be finished before this can start?
- What cannot start until this is finished?
Asking both directions catches constraints that a single pass misses. Record the type of each link — Finish-to-Start in most cases, Start-to-Start or Finish-to-Finish where work genuinely overlaps.
Model real constraints, not expected order
This is the distinction that determines whether the network is useful. "We usually do A before B" is a habit. "B physically cannot start until A is finished" is a constraint.
Encoding habits as constraints produces a network that is longer than reality and a critical path that is fiction. Every link should survive the question: what breaks if these run in parallel? If the answer is "nothing, it would just be unusual", it is not a dependency.
Step 3 — Draw the network
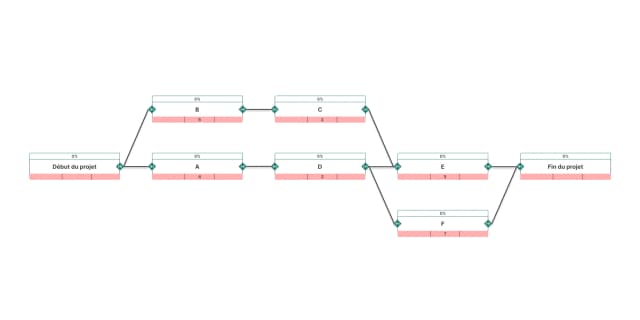
Each activity is a node; each dependency is an arrow. The network must be acyclic: no path may lead back to its own starting point.
Two structural features deserve attention as you draw:
- Convergence points — nodes where several chains meet. These concentrate risk: they cannot start until the slowest predecessor finishes, so they absorb every upstream delay.
- Long single-thread chains — sequences with no parallelism. They are entirely exposed: any slip anywhere propagates fully.
Step 4 — Add durations
Assign a duration to each activity. Where uncertainty is high, use a three-point estimate rather than a single number — the PERT formula exists precisely for this.
Durations are work time, not calendar time, and they belong to the activity, not to the person. Mixing the two — "two days, but Marc is only in on Thursdays" — is how resource constraints get silently encoded as logical ones.
Step 5 — Compute the critical path
The forward and backward pass described here is the standard critical path method, documented in the PMI standards.
With the network and durations in place, run the forward and backward passes to obtain earliest and latest dates, then the float per activity. The chain with zero float is the critical path.
At this point the network stops being a drawing and starts being a decision tool: you know which delays matter and which do not. Keeping that answer current after every change is the part worth automating — see PERT chart software.
The four errors that make a network useless
- Circular dependencies. A depends on B, B depends on A. The calculation cannot resolve. Common when a network is built by hand across several sessions.
- False constraints. Habits recorded as dependencies. Inflates the critical path and hides genuine parallelism.
- Resource constraints modelled as logical ones. Two tasks sequenced because one person does both. This is real, but it belongs to resource levelling — encoding it in the logic makes the network wrong as soon as staffing changes.
- A network built once and never updated. The critical path moves when durations change. A network that is not recomputed describes a project that no longer exists.