
Gantt chart Excel template: the dates chain, the bars draw themselves
You enter a duration and name a predecessor; the start date is calculated, the bar lands on the timeline, and everything depending on that task moves with it. Working days and public holidays included.
The idea: a Gantt chart is not about drawing bars
It is about answering who waits for what, and what it costs when something slips.
A start date is almost never a decision
On a real project most tasks do not start on a date somebody picked: they start when the previous one is finished. Typing those dates by hand means copying out a calculation, and copying it all out again at the first delay.
A schedule is read in working days
A five-day task starting on a Thursday does not end on Monday. As long as the calculation ignores weekends and public holidays, every duration is slightly wrong, and the error adds up along the chain all the way to the final date.
What counts is the gap with the plan
An up-to-date schedule is comfortable, but silent: it shows where you stand, not how far you have drifted. A status per task and a count of late tasks are enough to surface what a neat chart tends to smooth over.
What the workbook contains
Four tabs, no macros, everything visible and editable. The calculation cells are locked so a formula does not get wiped by accident; the input cells stay free.
A schedule and its timeline on the same row
On the left, one row per task: name, phase, owner, predecessor, duration, progress. On the right, 120 days of timeline with the week number, the day of the month and the day of the week. The bars draw themselves from the dates, the share already done appears in a darker shade, and a coral line marks today.
Dates that chain, not dates copied out
Pick a predecessor from a drop-down list: the start date becomes calculated, equal to the end of that predecessor plus one working day, lag included. A task starting on a fixed date keeps a date you type in the Fixed start column. That is the difference between imposed dates and calculated dates, held by formulas rather than by you.
Weekends, public holidays and milestones
Durations follow working days and skip the public holidays you list. On the timeline, non-working days are greyed out, but a bar crossing them stays continuous, as on a real Gantt chart. A duration of zero creates a milestone, shown as an amber marker on a single day.
A dashboard that says what has slipped
Start, planned end, overall progress weighted by the durations, and the number of tasks already late, which turns red from the first one. Below, progress by phase and workload by owner, plus the list of milestones with their date and status. A task entered without a date is flagged in red instead of going unnoticed.
A useful schedule is not a pretty schedule. It is one where every slip propagates on its own.
How to use it
Five steps. The third one changes everything: name the predecessor instead of typing the date.
One project in two misses its date
Not an impression: the same measurement two years apart, on samples of several thousand practitioners.
- 48%
of projects finish with a variance against the original schedule
PMI, Pulse of the Profession 2018, 4,455 practitioners - 63% vs 39%
organisations mature in project management meet their schedule, against immature ones
PMI, Pulse of the Profession 2020, 3,060 practitioners - 25%
of failed projects cite inadequate planning among the main causes
PMI, Pulse of the Profession 2018
The 24-point gap between mature and immature organisations does not come from better tracking. It comes from what was done before kickoff.
Where this workbook stops
Better said now than discovered in month three: a Gantt chart on a spreadsheet holds as long as the project stays simple. Four things are missing, and none of them is fixed by one more formula.
The workbook does not know which tasks drive the end date
This workbook calculates the earliest dates, not the latest ones: it does not walk the network backwards from the end of the project. So you see where each task sits, but not which one will push the delivery if it runs two days late. That is the only question that matters in a steering meeting, and it is the one our PERT chart Excel template answers, with the float of every task.
A task takes a single predecessor
On a real project a task often waits on two or three things at once, and the latest one drives the start. The workbook handles one: for the others you arbitrate in your head, and that arbitration is written nowhere.
Nothing keeps the previous schedule
When you move a date, the old one disappears. There is no way to compare what you announced with what actually happened, so no way to know how far off your organisation is, or in which direction.
Two people, two versions
As soon as it travels by email, the file forks. On a shared drive, editing at the same time breaks one person's filters while the other sorts. Nobody knows which copy is authoritative, and it is rarely the one on the screen in the meeting.
None of these four points is a flaw in the template. They are the limits of the medium.
The spreadsheet, and then what
With the workbook
The right tool to lay out a first schedule and show it to someone.
- One predecessor per task, the others handled in your head
- No idea which tasks drive the end date
- The previous schedule is overwritten at every change
- No arrows drawn between tasks
- One file per person as soon as it circulates
With Orchesia
The same logic, held by the tool rather than by you.
- A full dependency network, several predecessors per task
- The critical path highlighted in one click
- A saved baseline, comparable with the current schedule
- The dependency links drawn on the diagram
- One schedule, shared, updated live
Staying on Excel?
It is often the right reflex for a first schedule: nothing to install, everyone can open it. The file is sent immediately after you confirm, with no email to wait for.
What you get
- 104 KB .xlsx workbook, no macros, works in Excel, LibreOffice and Google Sheets
- Four tabs: how to use, settings, schedule, dashboard
- 60 tasks and 120 days of timeline, extendable
- Formulas visible, calculation cells protected against accidental overwriting
Frequently asked questions
Yes, and with nothing asked beyond your email address, which is used to send you the file. You are only subscribed to the newsletter if you tick the box for it, and the file is sent the same way either way.
The file is a plain .xlsx with no macros. It opens in Excel, in LibreOffice Calc and in Google Sheets. On Google Sheets the bars rely on conditional formatting rules that are converted, but the two dashboard charts may look slightly different.
If the task waits on nothing, its start date is the one you type in the Fixed start column. If you give it a predecessor, its start becomes the end of that predecessor plus one day, plus any lag. The end is the start plus the duration minus one, in working days if the setting is on Yes, public holidays removed.
Yes, the Lag column accepts a negative number. A lag of minus two starts the task two working days before its predecessor ends, which is the overlap commonly used between design and build.
By putting zero in the Duration column. The task becomes a marker on a single day, shown in amber on the timeline, and it appears automatically in the milestone list on the dashboard with its date and status.
No, this workbook focuses on the calendar: dates, bars and delays. The critical path also needs the latest dates calculated across the whole dependency network, with several predecessors per task. That is what the PERT chart Excel template does, also free: it gives the float of every task and turns the ones driving the end date red.
Only the ones carrying a formula or a header, so a paste does not wipe them. Every input cell stays free: settings, public holidays, and the task, phase, owner, predecessor, lag, fixed start, duration and progress columns. If you want to change a formula, the protection comes off from the Review tab with the password “orchesia”.
Sixty rows and 120 days of timeline are provided. Beyond that you have to extend the formula ranges and the conditional formatting areas. It can be done, and it is also the moment where a spreadsheet starts costing more time than it saves.
Further reading
The methods behind the tool, explained in detail.
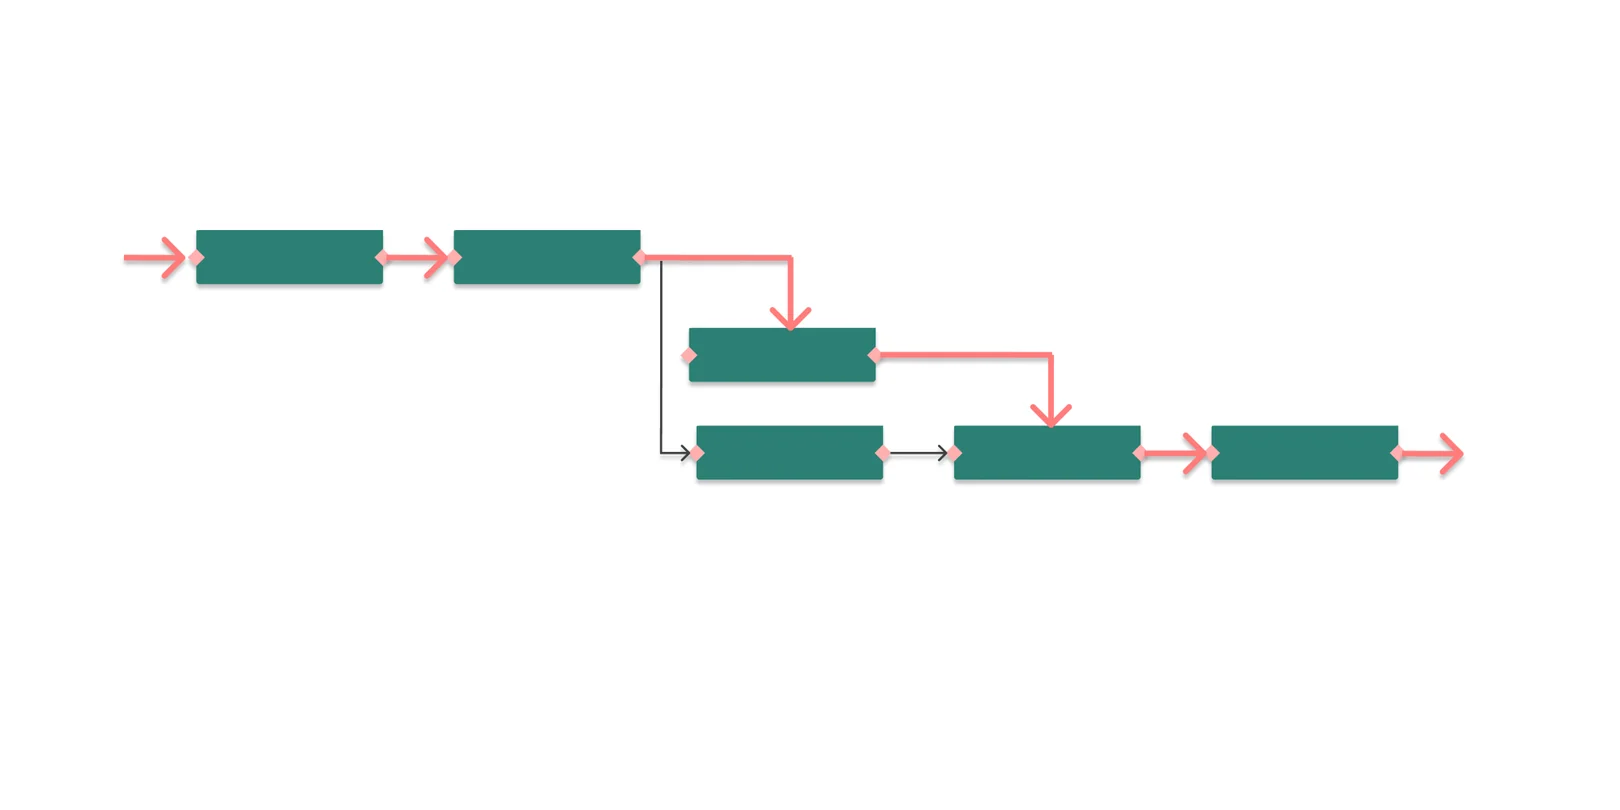 What is the critical path in project management?The critical path is the longest chain of dependent tasks in a project. It sets the minimum duration — and any delay on it moves the end date.
 How to estimate the duration of a task in a projectWho estimates, under what conditions, and why the buffer must not hide inside the figure. The six rules that make an estimate usable.
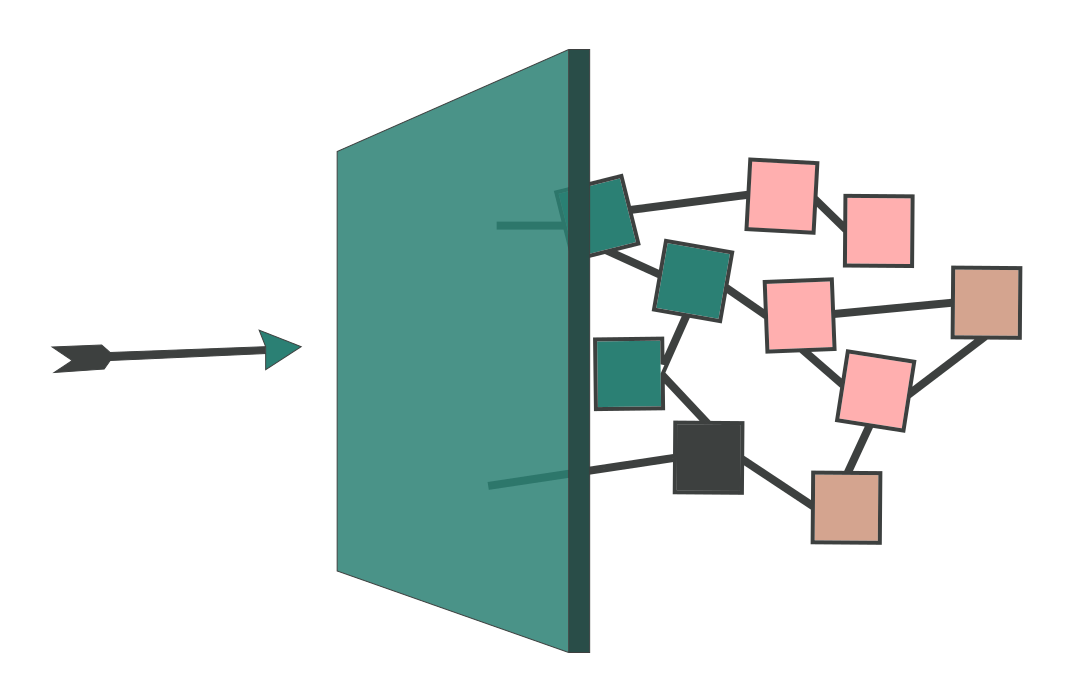 Hidden dependencies: why blockers appear too lateMost project delays do not come from tasks running long. They come from dependencies nobody modelled — discovered at the moment they block something.
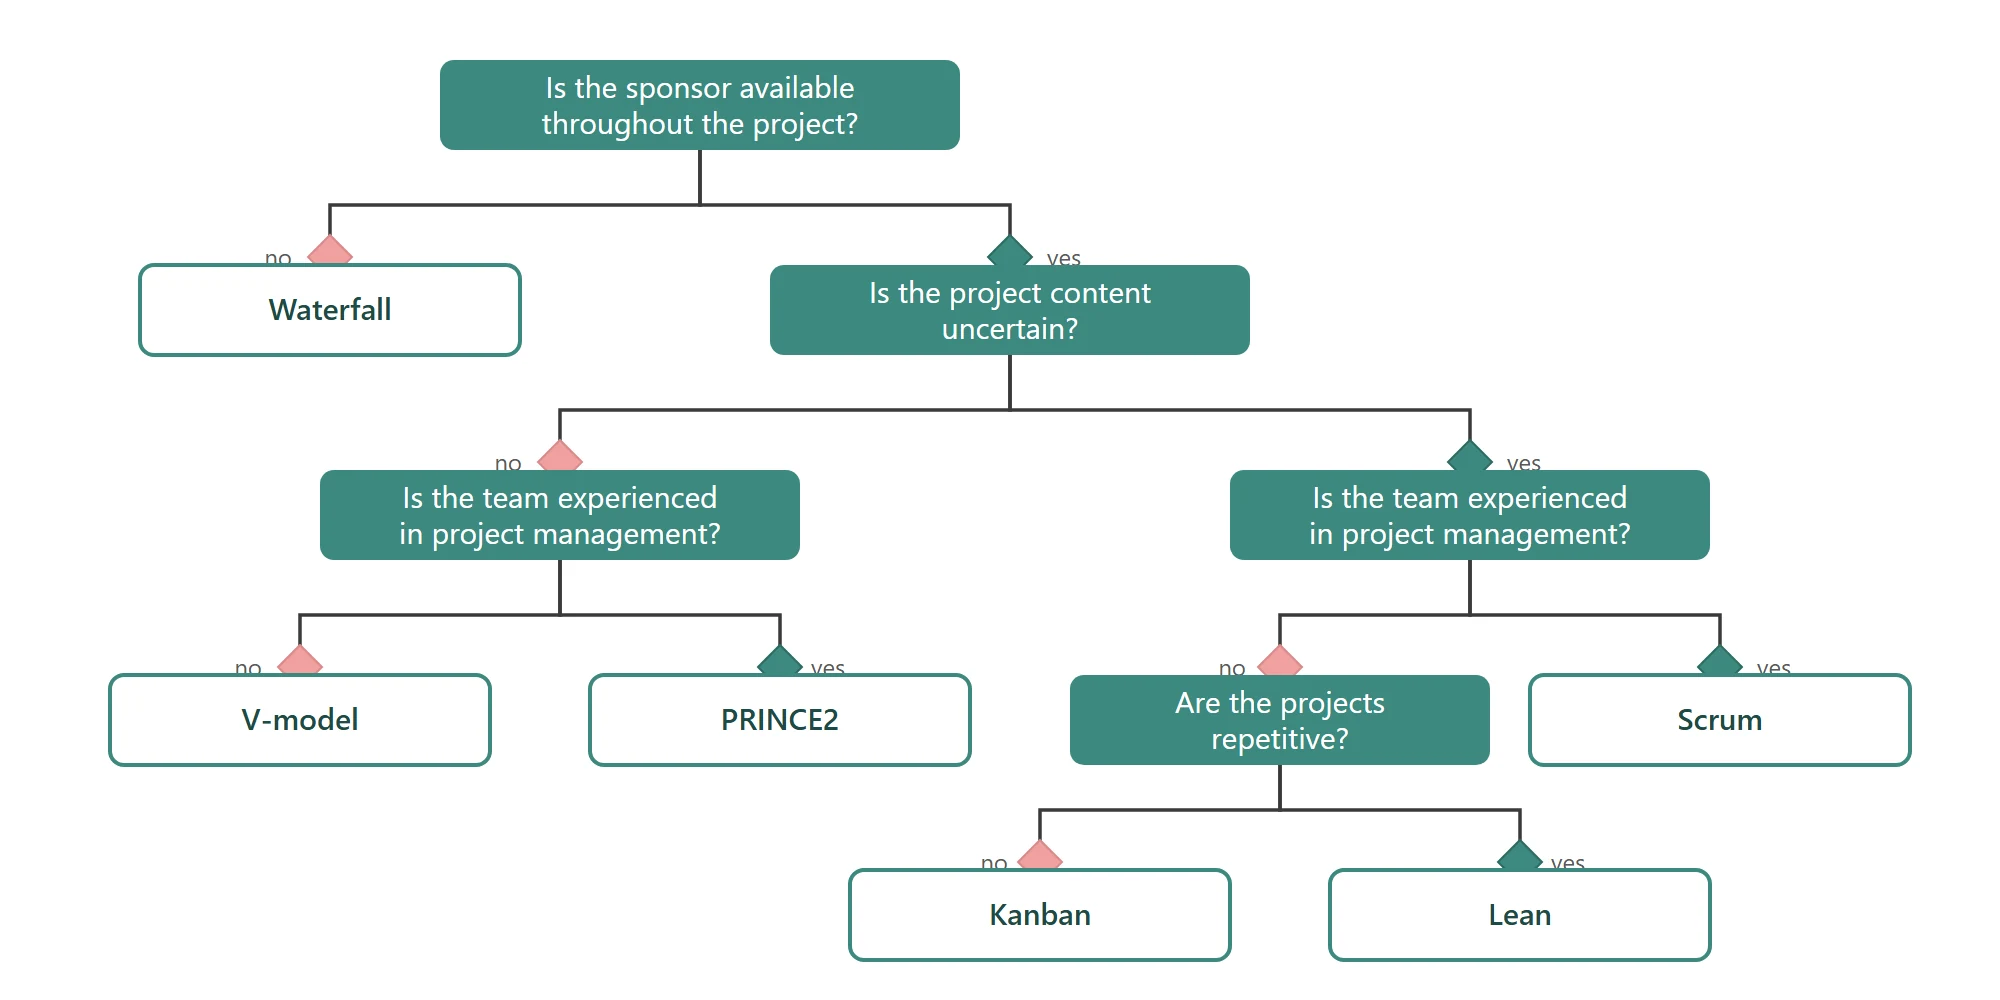 Project management methodologies: agile and traditional approachesWaterfall, V-model, PRINCE2, Scrum, Kanban, Lean: what each method fixes at the start, what it leaves open, and the situations where it holds.
The workbook lays out the schedule. The software tells you what holds it together.
Several predecessors per task, the critical path highlighted, and a baseline to measure the gap with what you announced. Free 30-day trial, no credit card.