
Agile project management Excel template: the workbook that calculates what fits in a sprint
A prioritised backlog, dated cycles, each person's declared availability, and a load-against-capacity gauge that fills up while you plan. Free, no macros.
The idea: you do not fill a sprint, you fill it up to a limit
And that limit can be calculated.
Capacity is not the number of people
Five people over two weeks is not ten person-days each. It is the sum of what everyone can actually give to the subject, week by week. The workbook makes you declare that number instead of assuming it.
A cycle is a closed period
Two dates, not an intention. The length of the cycle turns days per week into a total in hours, and that total becomes the ceiling. Anything above it is a decision to make now, not a bad surprise at the review.
The comparison has to be visible during the meeting
A total that only appears afterwards is useless. Here the utilisation rate changes with every item pulled into the cycle, with colour thresholds you set. The discussion stops when the gauge is full, not when the hour is up.
What the workbook contains
Four tabs, no macros, everything visible and editable. The calculation cells are locked so a formula does not get wiped by accident; the input cells stay free.
A dashboard that answers at a glance
You pick the cycle at the top, and four indicators recalculate: team capacity, planned load, utilisation rate, capacity left. A sentence underneath says where you stand, and the rate turns amber then red according to the thresholds you set. Two charts complete the picture: capacity against load per cycle, and load per person.
Capacity declared person by person
A grid crosses your members with your cycles: for each cell, the number of days actually available per week, from 0 to 7. Five for someone full time on the subject, two for someone splitting their week. The capacity of the cycle follows from the dates, the working-days setting and the number of hours per day.
A backlog that covers several projects
One hundred and fifty rows ready to use, with an automatic id, drop-down lists for the project, the phase, the owner and the status, coloured MoSCoW priorities, and a remaining effort calculated from progress. The Cycle column is the one that matters: it is what pulls an item into a sprint, and unplanned items appear greyed out.
The load spread, person by person
Under the dashboard, a second table gives each member their capacity on the cycle, what is assigned to them and their utilisation rate. This is where the imbalance a team total hides shows up: a team at 70% can perfectly well hide someone at 130%.
A well-planned sprint is not a full sprint. It is one the team knows will hold.
How to use it
Five steps, and only one really changes the outcome: declare availability before loading the cycle, not after.
A third of SMEs use no project management software
And among those that do, the majority want to switch.
- 35%
of SMEs use nothing beyond spreadsheets, email or paper
Capterra 2018, 753 respondents, 250 in SMEs - 55%
of employees equipped with project software are looking to change tool
Capterra 2018 - 2 to 15%
of projects consistently apply a research-backed method
PMI, Pulse of the Profession 2018
Where this workbook stops
Fair to say it now that you have it: a planning spreadsheet holds the first few weeks well, then it drifts. Always for the same four reasons, and none of them is fixed by one more formula.
The workbook does not know what happened yesterday
It recalculates what you type, when you type it. A task finished, a duration revised, someone moved onto another subject: nothing comes back on its own. In practice the file is right on the day of the meeting, then it ages until the next one.
Two people, two versions
As soon as it travels by email, it forks. On a shared drive, editing at the same time breaks one person's filters while the other sorts. Nobody knows which copy is authoritative, and it is almost always the wrong one on the screen.
One file per team, but people sit in several
The backlog covers several projects as long as they fit in this workbook. The day another team opens its own, the same person appears in two files with two declared availabilities, and nothing reconciles them.
No trace of what had been promised
When you overwrite the capacity of a cycle to prepare the next one, the old one disappears. There is no way to compare what you planned with what actually got done, so no way to know how far off your organisation is, or in which direction.
None of these four points is a flaw in the template. They are the limits of the medium.
The spreadsheet, and then what
With the workbook
The right tool to lay out the method and convince the team it is worth it.
- You type the capacity by hand at every cycle
- The file is right on the day of the meeting
- One team, one file
- History is overwritten at every new cycle
- Real load only exists if somebody types it in again
With Orchesia
The same logic, held by the tool rather than by you.
- The backlog covers all your projects, all the time
- Drag and drop updates the gauge live for everyone
- Cycles are shared between the teams of the same workspace
- Past cycles stay available
- Progress comes from the real work, not from a re-entry
Still prefer Excel?
That is a fair choice, and often the right one to start with: the workbook does the arithmetic properly, and there is nothing to install. The file is sent immediately after you confirm, with no email to wait for.
What you get
- 83 KB .xlsx workbook, no macros, works in Excel, LibreOffice and Google Sheets
- Four tabs: how to use, settings, backlog, dashboard
- Six cycles and ten members provided, extendable
- Formulas visible, calculation cells protected against accidental overwriting
Frequently asked questions
Yes, and with nothing asked beyond your email address, which is used to send you the file. You are only subscribed to the newsletter if you tick the box for it, and the file is sent the same way either way.
The file is a plain .xlsx with no macros. It opens in Excel, in LibreOffice Calc and in Google Sheets. On Google Sheets the conditional formatting and the drop-down lists are converted, but the two charts may look slightly different.
Only the ones carrying a formula or a header, so a paste does not wipe them. Every input cell stays free: settings, cycle dates, availabilities, backlog, and the cycle being analysed. If you want to change a formula, the protection comes off from the Review tab with the password “orchesia”.
One person's capacity is days available per week, multiplied by the number of weeks in the cycle, multiplied by the number of hours per day. The capacity of the cycle is everyone added up. The number of weeks comes from the two dates: working days divided by five with “Working days only” set to Yes, calendar days divided by seven otherwise.
No. Everything is expressed in time, because availability is declared in days, not in points. If your team estimates in points and steers by velocity, this workbook is not for you. If it estimates in hours or days, this is exactly the template.
There is no dedicated time-off feature. That is deliberate: availability is declared per cycle, so if someone is away half the period, you lower their number of days per week for that cycle. One line to change rather than a calendar to keep.
Six cycles and ten members are provided. Beyond that you have to extend the dashboard formula ranges, which point at those rows. It can be done, and it is also the moment where a spreadsheet starts costing more time than it saves.
The logic is the same, it is simply held by the tool: the backlog covers all your projects all the time, drag and drop updates the gauge live for the whole team, and past cycles stay available. The workbook only knows what you typed the last time you opened it.
Further reading
The methods behind the tool, explained in detail.
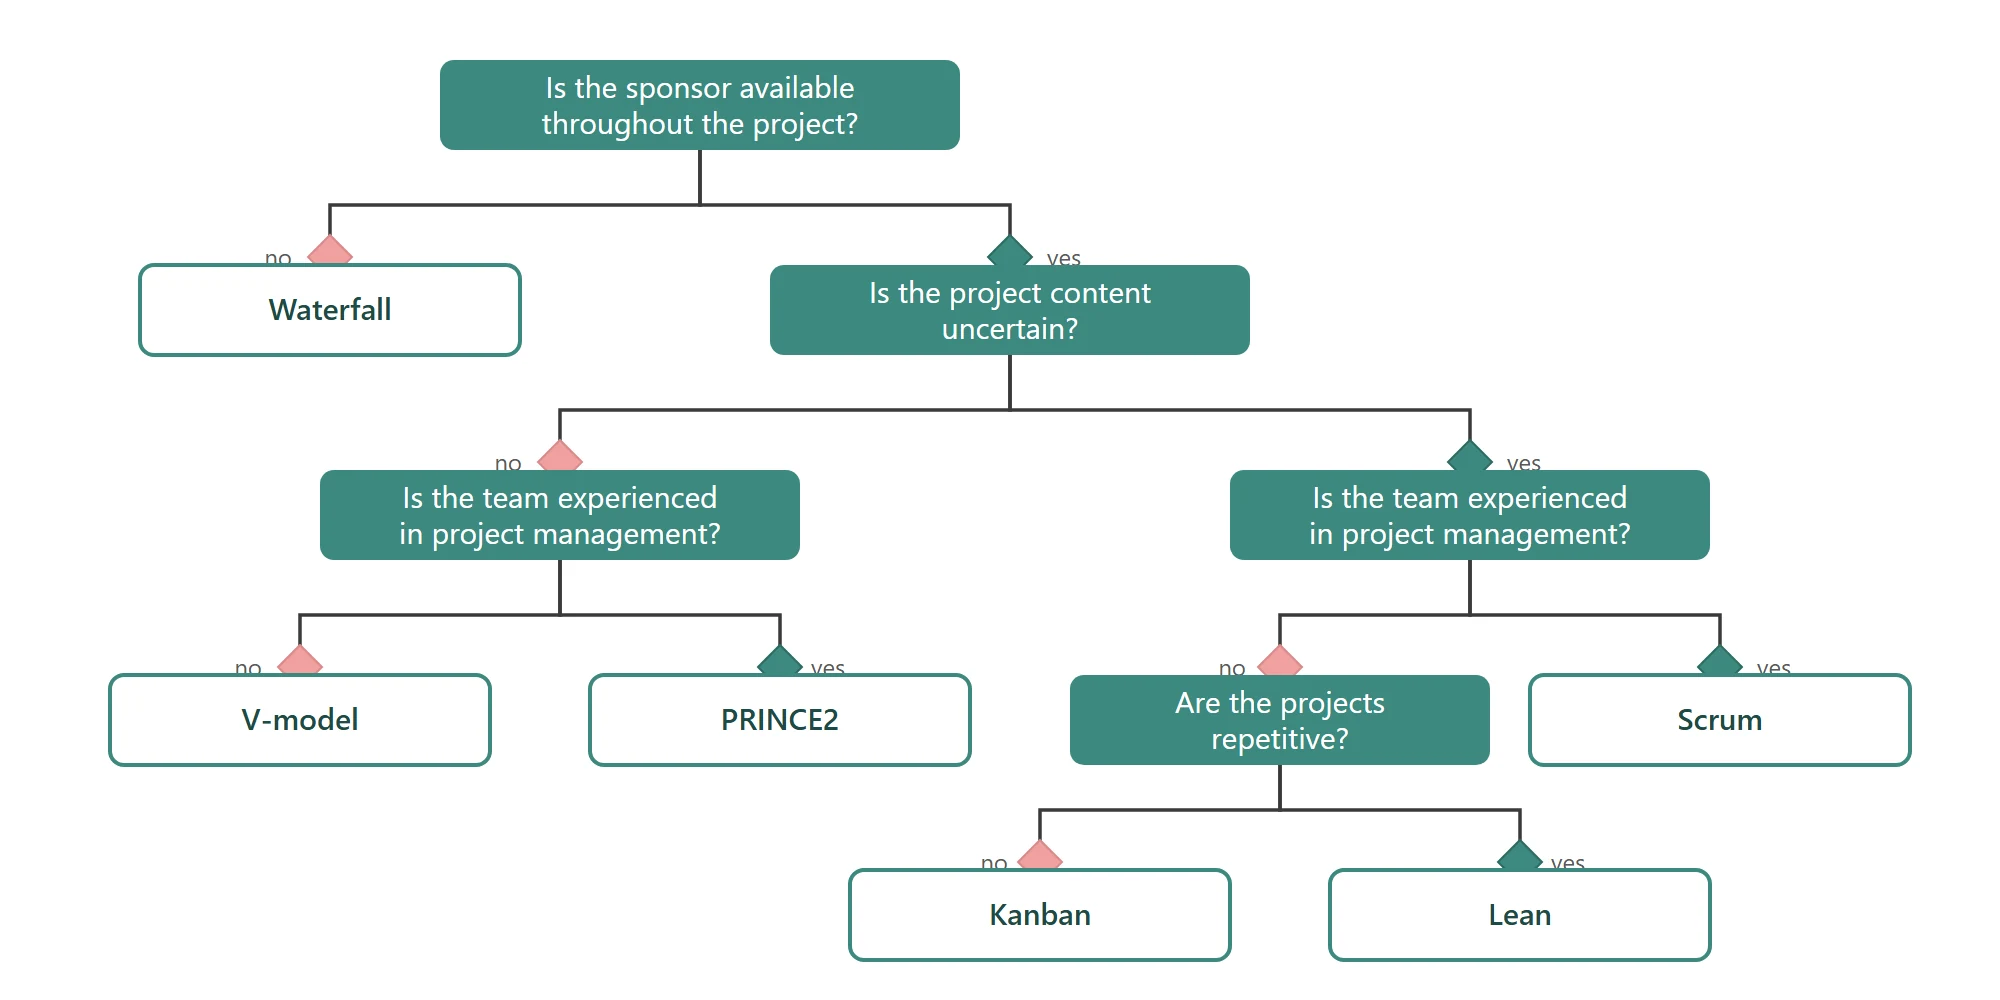 Project management methodologies: agile and traditional approachesWaterfall, V-model, PRINCE2, Scrum, Kanban, Lean: what each method fixes at the start, what it leaves open, and the situations where it holds.
 How to estimate the duration of a task in a projectWho estimates, under what conditions, and why the buffer must not hide inside the figure. The six rules that make an estimate usable.
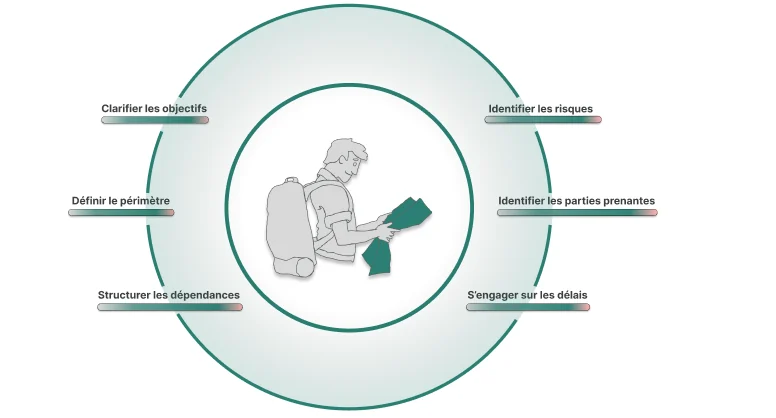 How to scope a project before you commit to a dateFraming is not paperwork. It is the last moment where a decision is cheap. Here is what a scoping stage has to produce before anyone opens a schedule.
 What is a project? Definition and life cycleA project is a temporary effort aimed at a unique outcome, delivered under constraints and uncertainty. Here is what that means in practice, and why the framing decides the outcome.
The workbook shows you the method. The software holds it for you.
Same reasoning, but the backlog covers all your projects and the gauge updates live. Free 30-day trial, no credit card.