A Gantt chart is a scheduling tool that lays a project out over time. It shows the tasks to be done, how long each one lasts, and where it sits in the calendar. Widely used in project management, it makes a schedule easy to read, progress easy to follow, and work easy to coordinate across several people.
A Gantt chart places the work in time. It shows when each activity has to happen and how it fits into the project as a whole. Being easy to read is what made it one of the most common ways to run a schedule.
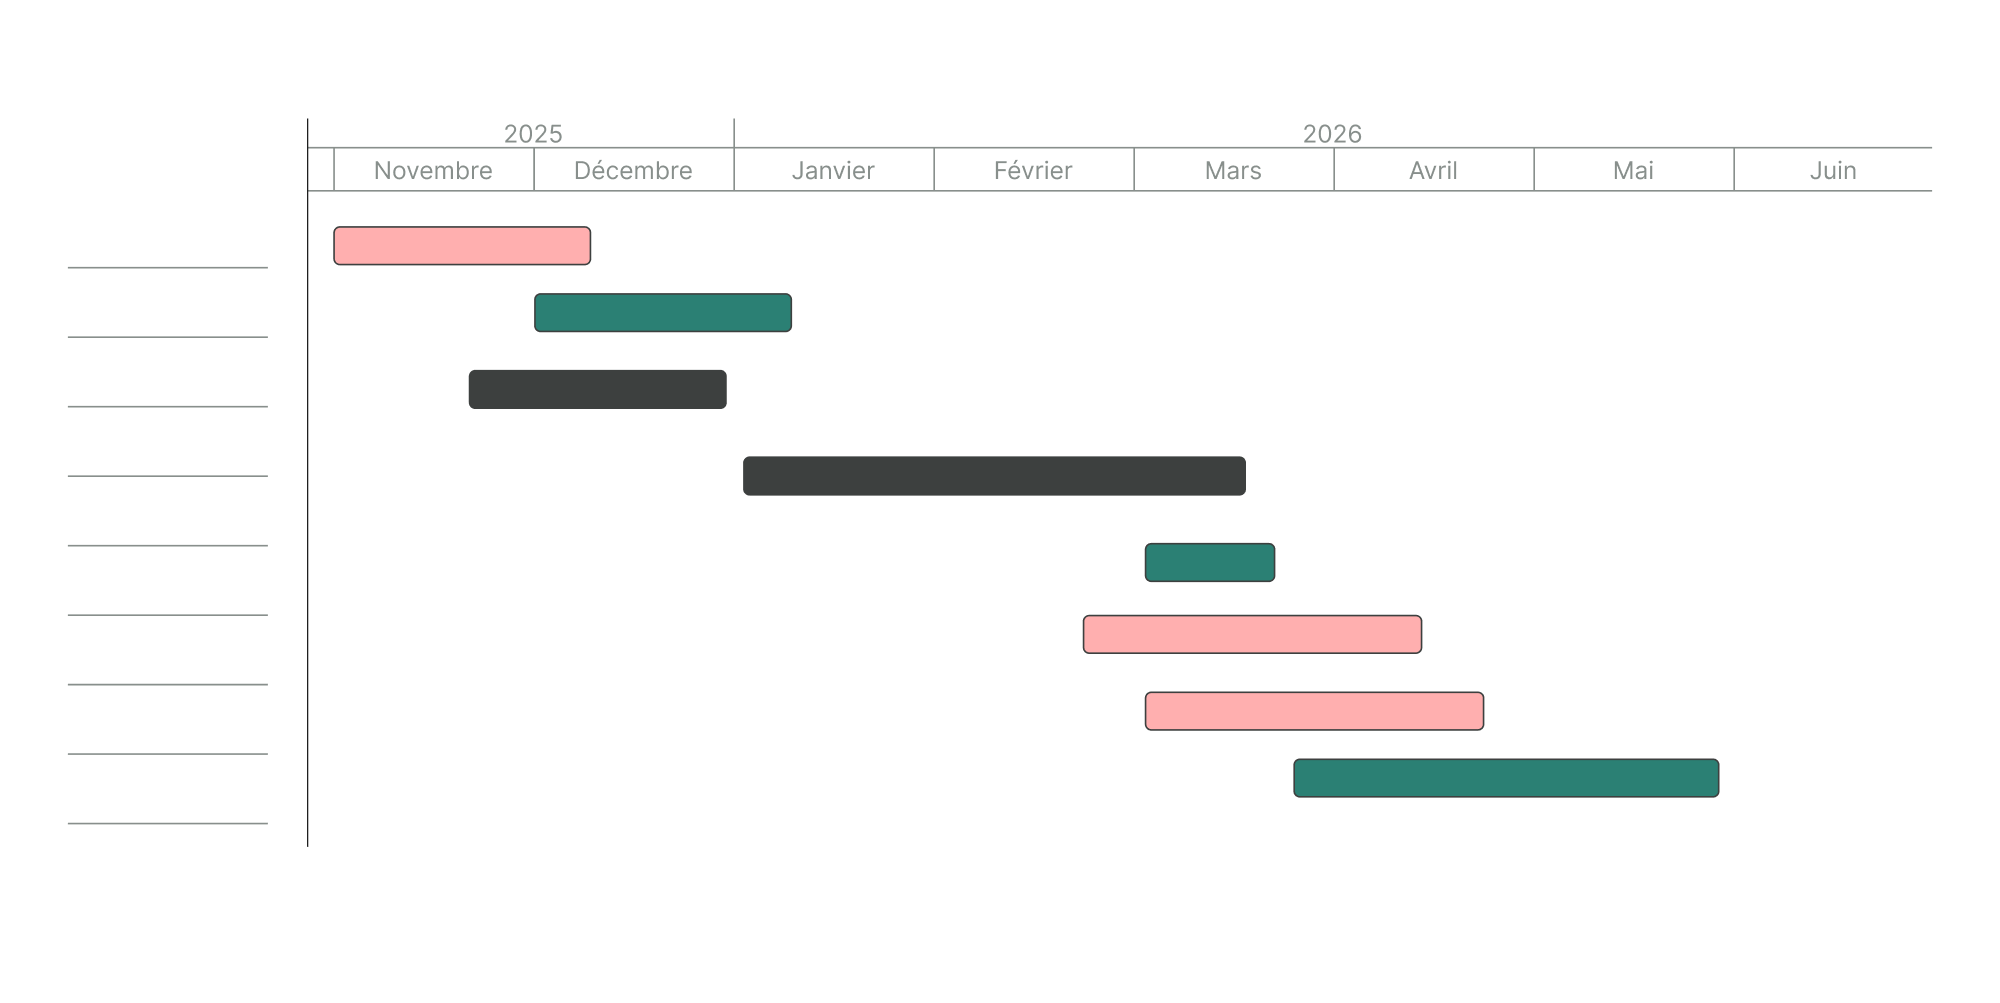
A Gantt chart: the project laid out over time
A Gantt chart is a graphical view of a project schedule. It shows the tasks on a time scale, so you can see when each one has to be done and how long it should take.
Each task is a horizontal bar. Where the bar starts is the start date, its length is the duration, and its right-hand end marks the finish date.
That turns a plain list of activities into a view of the project in time. You no longer see only what has to be done, but in what order and at what point.
A Gantt chart is what takes you from a description of the work to a dated schedule.
Why Gantt charts are so widely used
The Gantt chart is one of the most used tools in project management because it is easy to understand, even for people with no training in planning methods.
Looking at one, you can immediately see:
- which tasks are planned,
- when they start,
- how long they last,
- and when they are due to finish.
That readability makes it an effective way to communicate about a schedule. It gives teams, managers and stakeholders a shared view of the project.
In many organisations the Gantt chart also becomes the reference for discussing deadlines, priorities and commitments.
How a Gantt chart is built
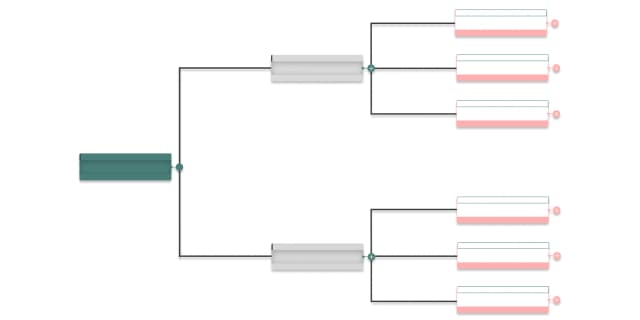
To build a Gantt chart you first identify the tasks that make up the project, then estimate how long each takes and work out the order they have to run in. See how a WBS defines the scope of a project.
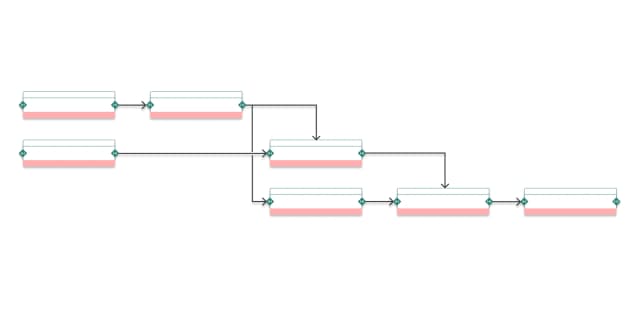
Once that is settled, the tasks are placed on a time scale. Some can run in parallel; others have to wait for an earlier activity to finish. See how dependencies are handled in a project.
The Gantt chart shows those sequences directly in the calendar. You can see where tasks overlap, which periods are busier than others, and whether the finish date is realistic.
Realism is not settled by dragging bars across a calendar. It rests on the work that comes first: the scope, the dependencies and the duration estimates, agreed before any date is committed.
In modern tools the Gantt chart is interactive. Changing a task's duration or its start date adjusts the rest of the schedule automatically, which makes corrections cheap.
A Gantt chart also tracks progress
The Gantt chart keeps earning its place once the project is under way: it is also how you follow what is actually happening.
As the work proceeds, you compare what was planned with what has been delivered. Some tasks take longer than expected, others finish early.
The Gantt chart makes those gaps visible and lets you anticipate what they do to the rest of the schedule. At that point it stops being a plan and becomes a control tool.
When a delay hits a structural sequence, the impact goes well beyond the task itself. That is exactly what the critical path identifies: the chain of activities that governs the project finish date.
This is why the chart is used throughout the project, from preparation to final delivery.
Readable whatever the project
Gantt charts are used across many fields, because they fit almost any kind of project.
You find them in software projects as much as in industrial programmes, construction sites, engineering studies or communication campaigns.
Wherever tasks have to be organised in time, a Gantt chart gives a clear view of the schedule.
Its strength is its simplicity. Even on a complex project the picture stays readable, which is what makes coordination possible between people who do not share the same expertise.
One of the fundamentals of project control
Laying activities out on a calendar is a documented practice, described among others in the PMI standards.
In project management the Gantt chart is usually treated as a basic tool.
It shows the schedule, but it always rests on work done beforehand. Before you can build one, the tasks have to be defined, their durations estimated, and their order understood.
A Gantt chart does not replace that structuring work. It is its translation into time: the point where the logic of the project becomes a calendar you can share.
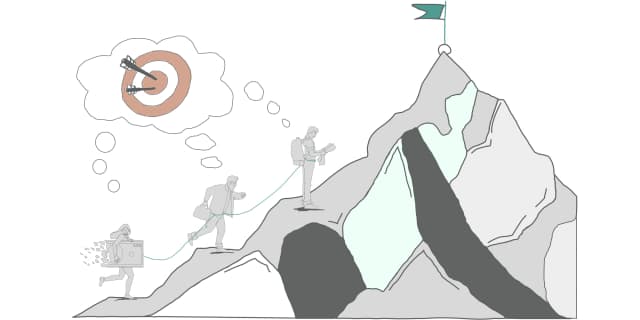
In the classic chain of project management tools, the WBS clarifies the what, the PERT chart exposes the in what order, and the Gantt chart commits to the when. Each answers a distinct question, and running them in that order is what makes the difference.
Once the schedule exists, it becomes the central support for running the project, tracking deadlines and adjusting decisions.
That is why it remains one of the most used tools in project management today.
Summary
A Gantt chart is a tool for laying a project out over time. It shows the tasks, their durations and their place in the calendar, so that a schedule can be built and then followed.
Its readability is what makes it so widely used to organise work, coordinate teams and track progress.
Simple as it is to read, a Gantt chart always rests on a project that has already been structured. Beyond the dates, it gives an overall view of how the work unfolds.
Understanding the Gantt chart is therefore a prerequisite for understanding how a schedule is built and how it can be steered. It is also why a Gantt chart generated from the structure of the project ages better than one typed in by hand: it recalculates instead of being redrawn.