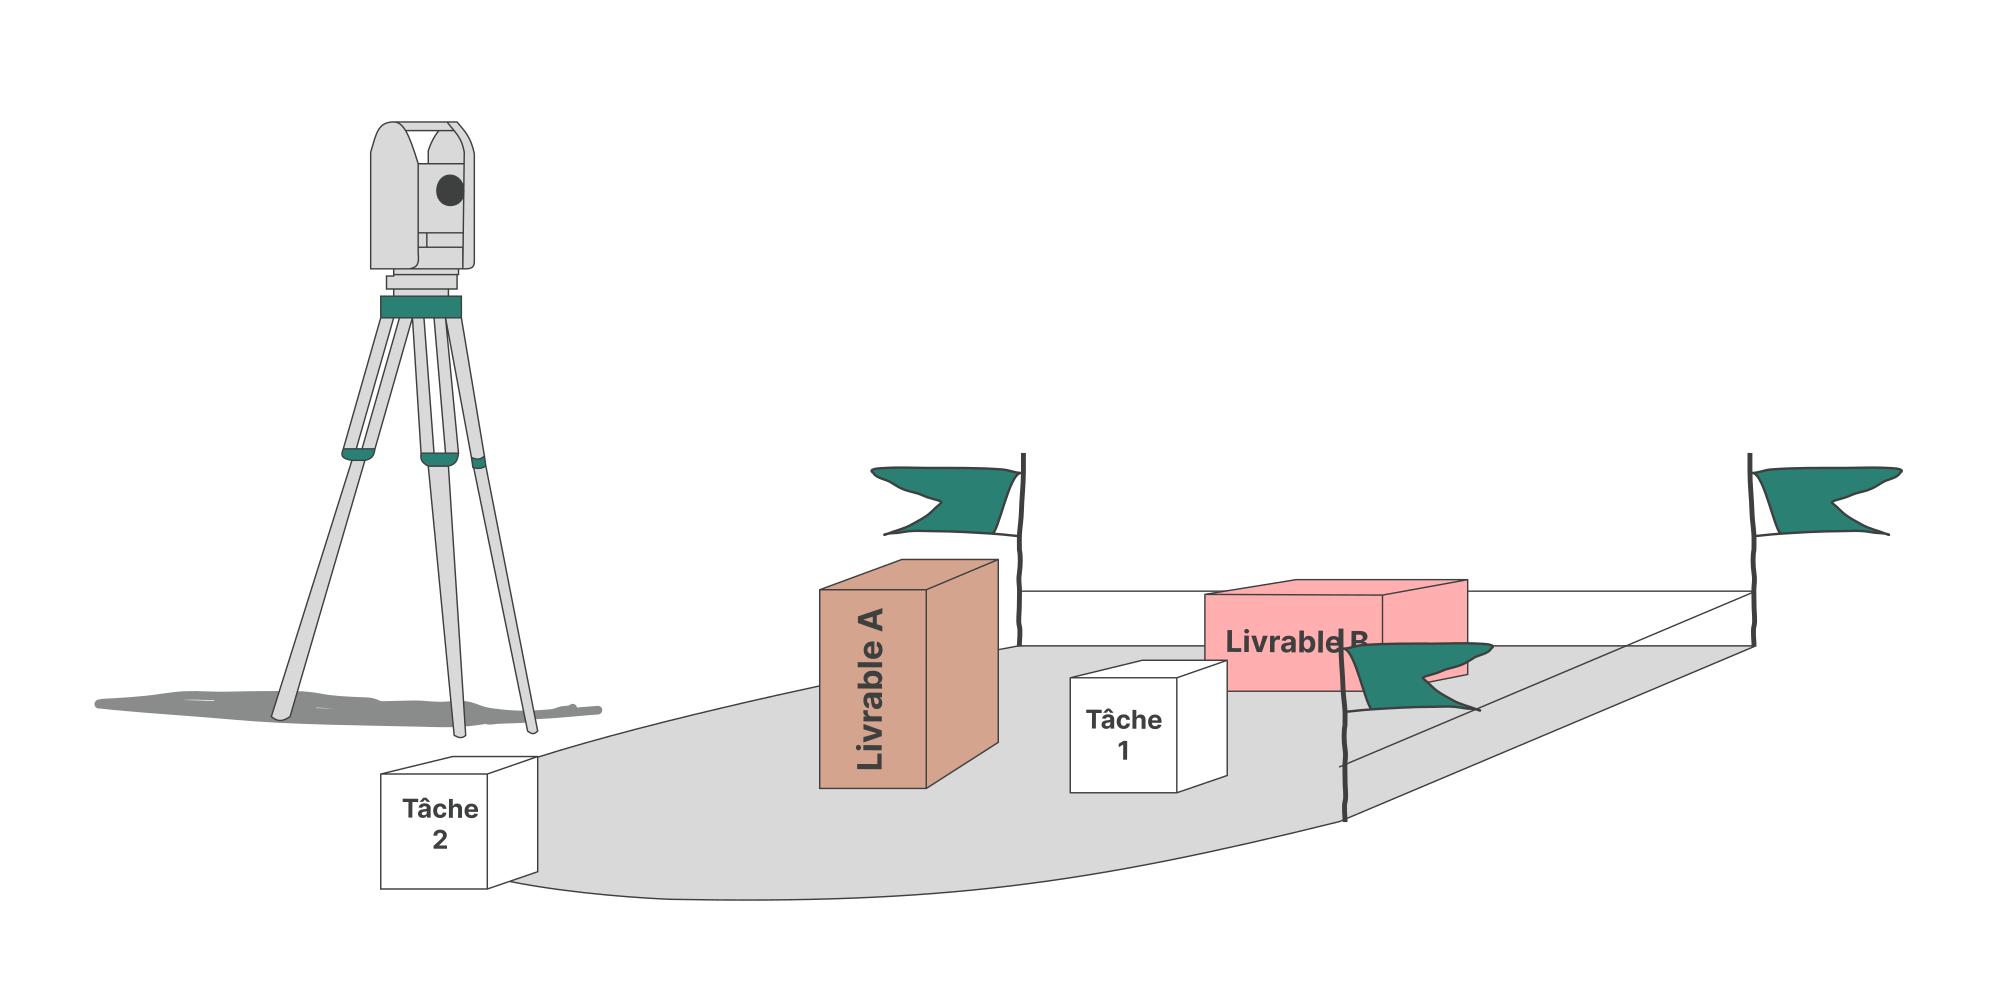
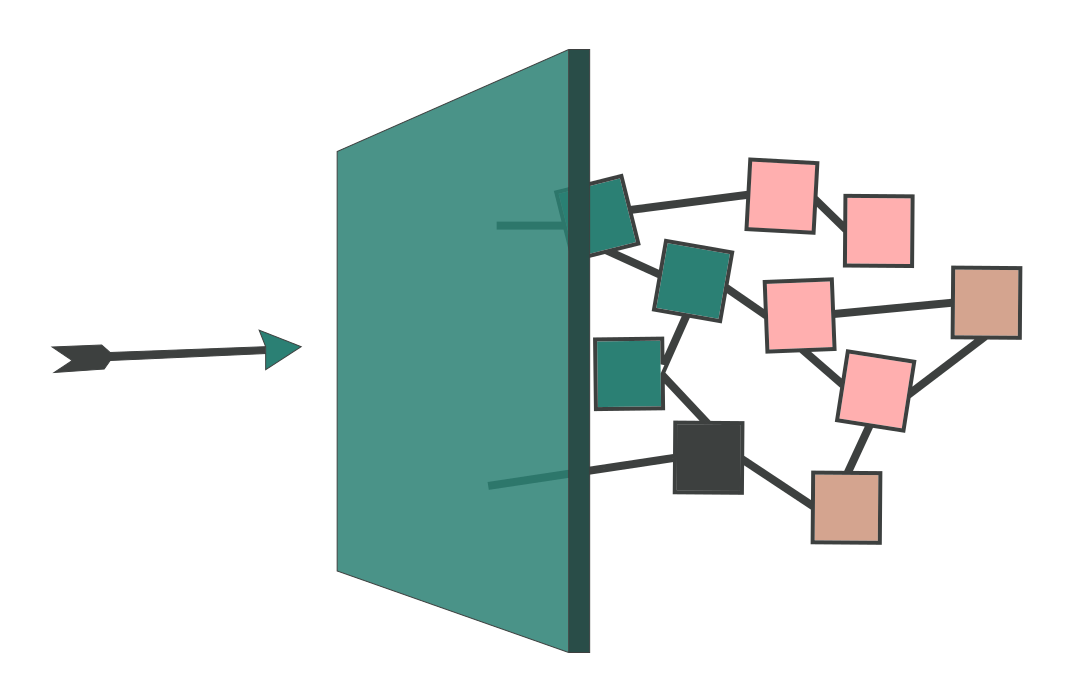
A delay does not spread at random. It spreads because a schedule rests on a network of dependencies. When the delay hits a critical task, meaning a task with no float, the end date moves by exactly the same amount. That is a question of structure, not of how well the team is organised.

The first reflex: look for what went wrong in the team
When a small slip moves the delivery date, the natural reaction is to look for an organisational cause: poor coordination, an underestimated task, a lack of anticipation.
That reaction is understandable. Seen from outside, a small problem seems to have triggered a disproportionate reaction, and something must have gone wrong somewhere.
In many cases, though, nothing went wrong in the team. The propagation is simply logical.
A schedule is a network, not a list
Most teams read a schedule as a sequence of tasks placed in time. In reality, it is a network of dependencies.
Every task waits for its prerequisites to finish before it can start. Some tasks run in parallel. Others can only begin once something specific is done. That network creates a structural constraint: changing one element can affect everything downstream of it.
Not every task is equal
When a delay occurs, there are two possible situations: either the task has float, or it does not.
A task with float can absorb a limited delay without touching the end date. A task without float, on the critical path, cannot: every day of delay carries straight through to the delivery date.
This is not a hypothesis. Float is a defined quantity, and the PMI standards give its calculation. It is float that decides whether a delay is absorbed or passed on.
The tasks with zero float form the critical path: the sequence that sets the minimum duration of the project. If a critical task slips by two days, the project slips by two days. There is no gradual effect and no natural compensation.
An example: the same delay, two opposite effects
Take an HR tool to roll out. Testing cannot start until two tasks are finished: configuring the modules, which takes ten days, and importing historical data, which takes four. Testing then takes five days, and delivery falls on day fifteen.
The import therefore has six days of float. The configuration has none.
Suppose the import runs two days late. It uses up two of its six days of float, and delivery does not move by a single day.
Now suppose the configuration runs two days late instead. Testing starts two days later, and so does delivery: day seventeen instead of day fifteen.
Same delay, two opposite effects. The difference is not in the task itself. It is in the float the task has, and that changes how you monitor a project: not every task deserves the same attention.
Why the propagation often looks disproportionate
A delay of a few days can look minor. But if it hits a convergence point, where several chains meet, a structuring milestone, or a cascading sequence, it can affect several branches of the project at once.
In the HR tool example, testing opens two branches: manager training and the rollout itself. Two days late on testing, and both branches move, along with everything that follows them.
The denser the network, the wider the propagation. That is what gives the impression that a small problem triggered an excessive reaction. In reality, the problem sat on a structural point.
Estimation or structure?
Both play a part, but not in the same place. A poor estimate explains where the delay comes from. The structure of the schedule explains how far it goes.
So when the date moves, there is no need to look for someone to blame. Look at where the delay landed.
Why this stays poorly understood
Many schedules are run without an explicit view of the network. You see dates, milestones and tasks. You do not always see which sequences actually set the duration, where the float sits, or which tasks are critical.
Without that view, the propagation of a delay looks unpredictable. With a network view, it becomes understandable, and you can see it coming.
What a PERT chart makes visible
The propagation becomes readable as soon as the project is drawn as a logical network, which is precisely the role of a PERT chart. It models the dependencies and lets you calculate the earliest dates, the latest dates, the float and the critical path, as described in the PERT formula and critical path calculation.
Those calculations identify the zero-float tasks immediately. They are the ones that set the minimum duration of the project, and when a delay hits one of them, the shift in the end date follows directly from the structure of the network.
Summary
A delay does not spread because a project is badly organised. It spreads because some tasks set the overall duration.
When a delay hits a task with float, it can be absorbed. When it hits a critical task, it propagates automatically.
Understanding this changes how you run a project: you stop monitoring every task the same way, and you watch the ones that actually decide the end date. Measuring the propagation means knowing the float of every task, which is exactly what dependency management software calculates.