Build a PERT Diagram: The Method to Visualize Your Project’s Dependency Network
Estimated reading time : 10 minKey takeaways:
Have you ever seen your entire schedule collapse because of a single poorly anticipated task that suddenly paralysed the progress of your whole team? To stop suffering from these costly disruptions, learning how to build a PERT diagram is the ideal answer to finally visualise the network of dependencies and the logical sequence of your actions. In this article, we guide you through concrete steps to turn a task list into a reliable management tool, capable of revealing the critical path and securing your deadlines.
- The foundations of the PERT diagram: from WBS to network
- Speaking PERT: the terminology you need to know
- Building the diagram: the precedence method in action
- Going further: a more flexible and realistic PERT diagram
- Practical case and tools: PERT in action
The foundations of the PERT diagram: from WBS to network
Why visualise your project’s dependencies?
Managing a project is more than a simple task list; the real challenge lies in the logical sequence of activities. The PERT diagram solves this problem by visually mapping dependencies so you can anticipate bottlenecks and secure deadlines.
It is the ideal tool for planning and scheduling, offering far greater clarity than a basic to-do list.
The starting point: the Work Breakdown Structure (WBS)
It is impossible to build a PERT diagram without a clear structure. A well-designed Work Breakdown Structure (WBS) breaks down the project and provides the raw list of actions required.
PERT then takes over. It transforms these tasks into a logical dependency network, marking the second key step in planning.
The 8 basic principles to follow
PERT follows a strict logic to guarantee readability and consistency. Here are the 8 golden rules to keep in mind:
- Draw the diagram from left to right (direction of time).
- Give each task a unique identification number.
- Minimise arrow crossings.
- Respect the precedence method.
- No loops (the network is acyclic).
- No logical conditions (no “if… then…”).
- A unique project start task and a unique project end task.
- A task only starts once all its predecessors are finished.
Speaking PERT: the terminology you need to master
Now that the foundations are in place, let’s get familiar with the specific vocabulary of PERT. These terms are essential to correctly build and interpret the network diagram.
The different types of tasks
Not all tasks play the same role: some drive what comes next, others are waiting in line. You absolutely need to distinguish them to avoid mistakes.
To make things clearer, here is a summary of the key roles a task can play:
| Term | Simple definition | Role in the project |
|---|---|---|
| Blocking task | A task that must be completed BEFORE another can start. | It is a prerequisite, a predecessor. |
| Blocked task | A task that CANNOT start until another is finished. | It is a successor; it depends on another task. |
| Connecting task | A task that must wait for SEVERAL previous tasks to be finished. | Convergence point for several paths. |
| Root task | A task that enables the start of SEVERAL following tasks. | Divergence point, launches parallel activities. |
Path, float and criticality: key concepts
Beyond individual tasks, PERT lets you visualise sequences and analyse their impact. It is the paths that give the planning tool its full power.
The critical path is the longest sequence. It determines the minimum duration of the project. Any delay here impacts the finish date. Tasks on the critical path – the critical tasks – have zero float.
Float is the amount of delay a task can absorb without affecting the total project duration. It is your breathing space to handle unexpected events.
Building the diagram: the precedence method in action
You now know the vocabulary and principles. Time for practice. Here is how to assemble your dependency network in concrete terms.
Identifying dependencies: the 3 key questions
This is the heart of the work. For each task in your WBS, you need to define its relationships with the others.
The precedence method is simple and extremely effective. Take each task one by one and systematically ask three questions. It is an exercise that requires rigour. A mistake at this stage, and your entire schedule becomes wrong.
Here are the 3 fundamental questions to structure your network:
- Which tasks must be finished immediately before this one? (Its predecessors)
- Which tasks can start immediately after this one? (Its successors)
- Which tasks can be carried out at the same time? (Parallel tasks)
From list to visual network
Once this analysis is complete, you have a list of all dependencies. All that remains is to translate them graphically. This is the most rewarding step.
On paper or in software, represent each task with a rectangle. Then draw arrows to represent the dependencies you have identified. Each arrow goes from the blocking task to the blocked task.
Your project network finally takes shape before your eyes. You can clearly see the logical sequence of all activities.
Estimating task durations
A dependency diagram is useful, but it only becomes a real planning tool once durations are added. Every task needs a reliable estimate. Estimating durations is a discipline in its own right. Don’t neglect it.
The original PERT method uses a probabilistic approach with three scenarios: optimistic, pessimistic and most likely. But to begin with, a single duration estimate per task is more than enough to build an initial schedule and identify the critical path.
Going further: a more flexible and realistic PERT diagram
A basic PERT diagram is already very powerful. But the reality of projects is often more nuanced. Let’s see how to refine the model so it sticks as closely as possible to what happens on the ground.
When Finish-to-Start links are too rigid
The standard rule “task B starts when task A finishes” is simple. Yet this rigidity often proves inefficient in real life. You lose precious time waiting for unnecessary completion.
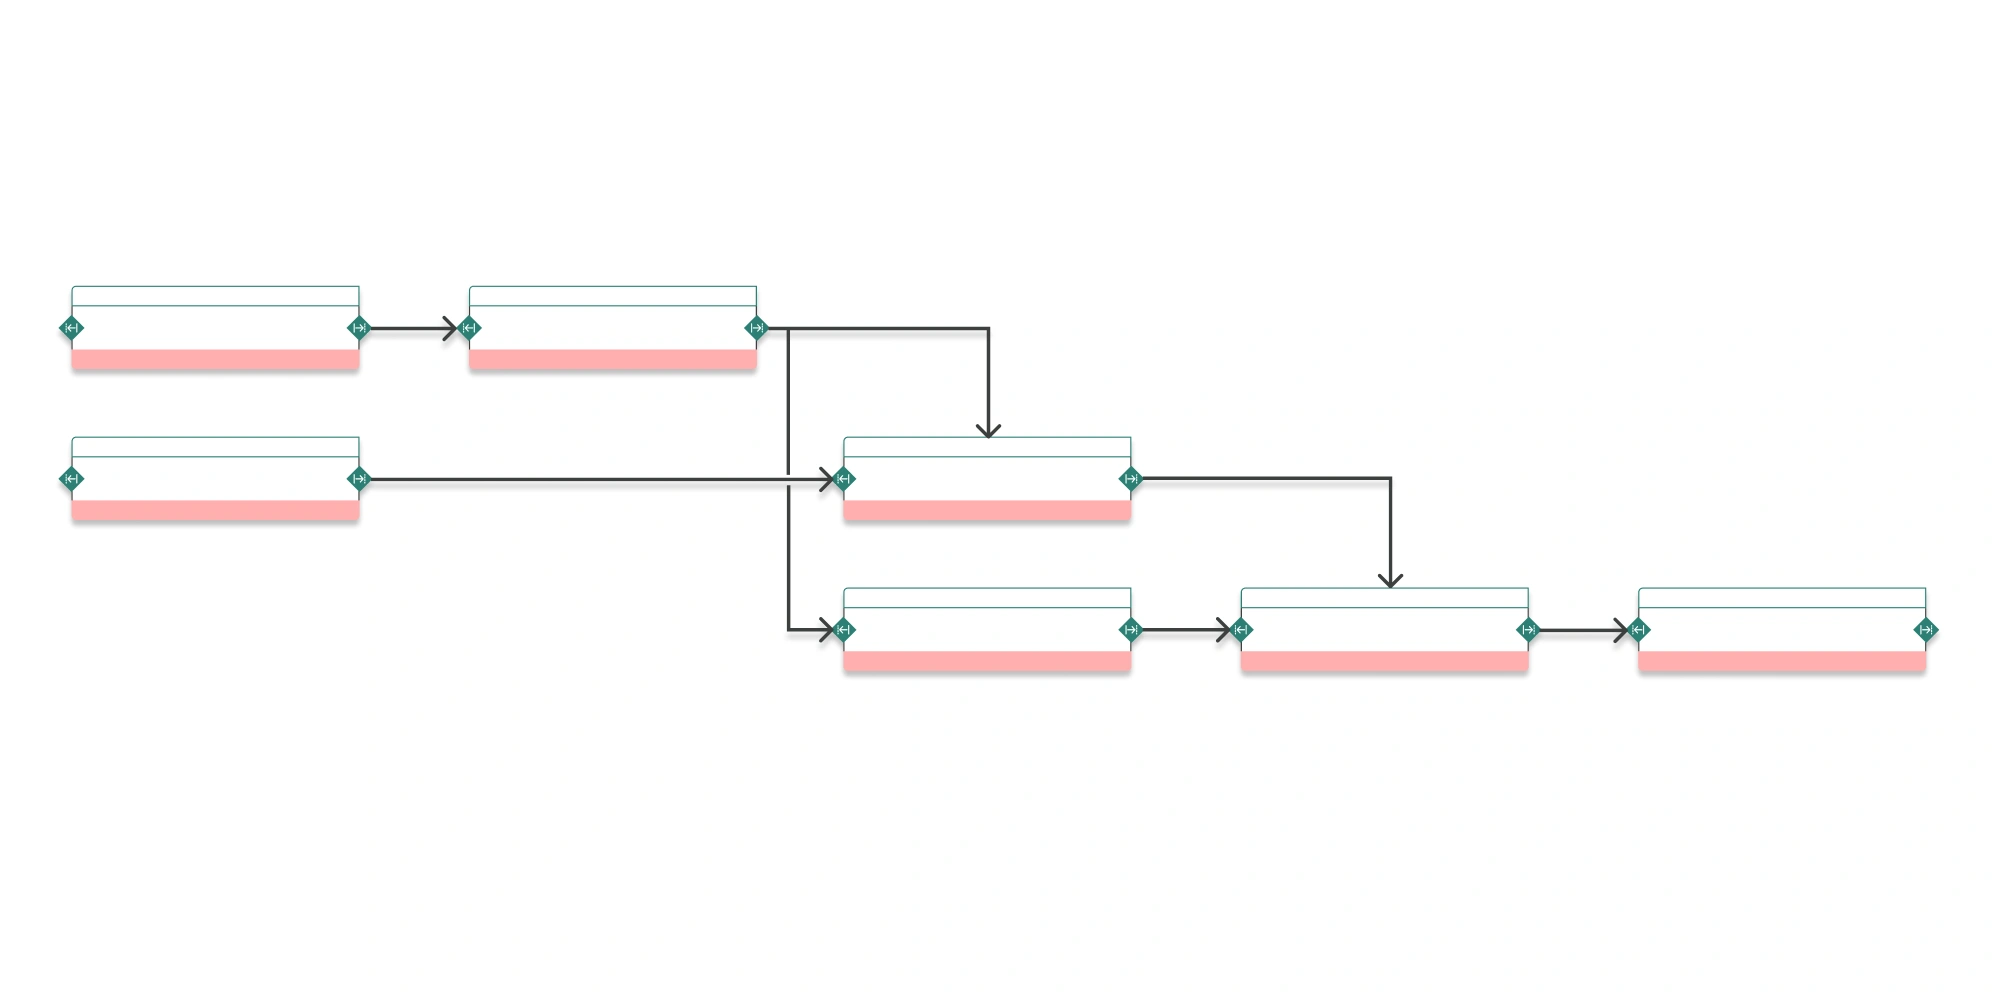
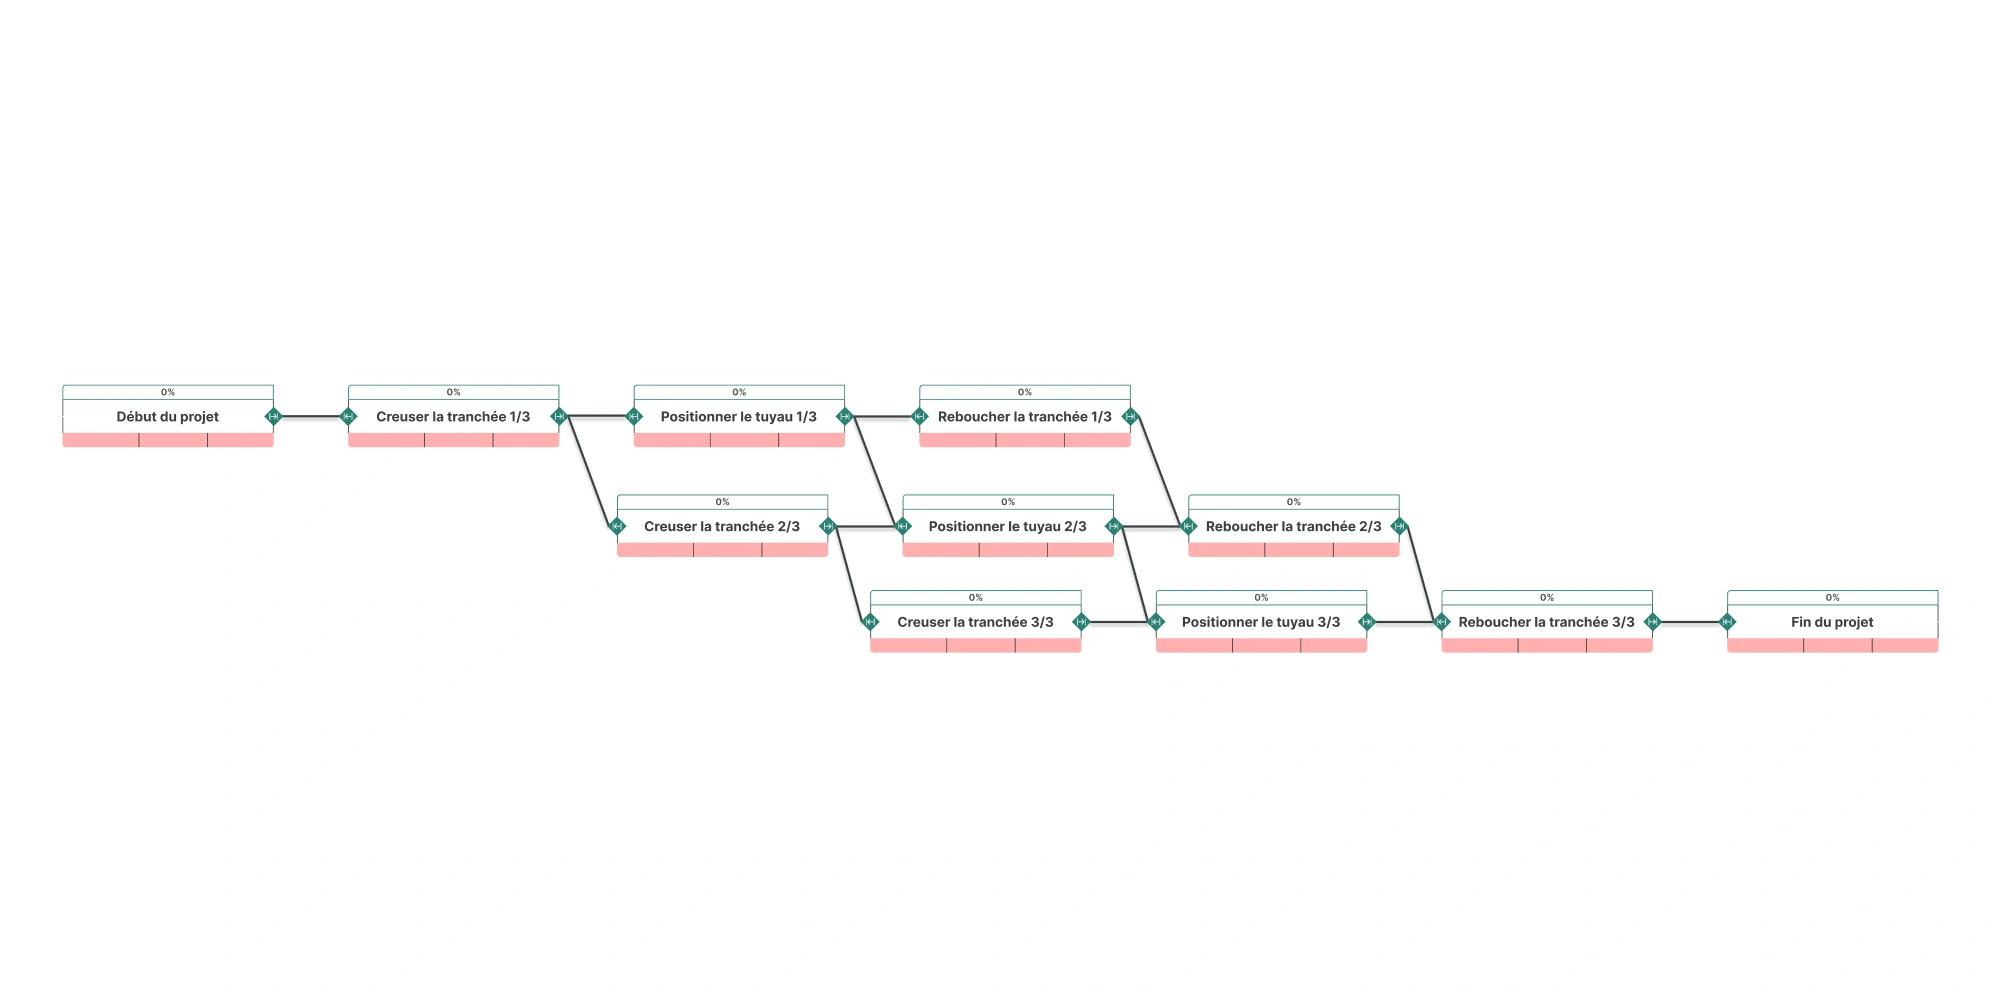
Take the construction example: digging the trench, laying the pipe, backfilling. Waiting for the entire trench to be dug before laying the first pipe is absurd. You can launch these tasks in progressive parallel to save time.
This is where advanced links come into play. They model these logical overlaps and directly speed up the project.
The 3 types of links for greater flexibility
To refine your planning, you have three specific link types at your disposal, going far beyond the classic Finish-to-Start relationship.
The Start-to-Start (SS) link launches two tasks at the same time, or almost. It is ideal for the pipe-laying example. The Finish-to-Finish (FF) link synchronises the completion of two activities to guarantee perfect consistency.
Adding a lag to these links gives you surgical precision. For example, it allows you to model drying times or delivery lead times without artificially blocking teams.
Laddering: an alternative
Another way to manage the pipe-laying flow is to break tasks down. Instead of a single global task “Dig”, you create “Dig segment 1”, then “Dig segment 2”, and so on. This smooths the mechanical sequence.
This approach, known as laddering, is very precise. But be careful: it can quickly make the diagram complex and hard to maintain. Use it sparingly.
Practical case and tools: PERT in application
Theory is all well and good, but let’s be honest: a concrete example is worth a thousand words. Let’s see how to apply all this in the field with modern tools.
Example: the visual identity of the Orchesia website
Let’s go back to our main example from the WBS article: the visual identity. As in many communication projects, the logo is the central element. All design decisions are built around it: colour palette, iconography, typefaces, button styles, illustrations…
As long as the logo has not been validated, no other graphic element can be final. The logo acts like a lock: until it is passed, all other tasks remain on hold.
A critical path entirely structured around the logo
The sequence of logo creation follows a very linear chain:
- 1.1.7.3.1 – Benchmark and select a graphic designer
- 1.1.7.3.2 – Present the concept and requirements
- 1.1.7.3.3 – Select a logo from the proposals
- 1.1.7.3.5 – Test the logo with a user panel
- 1.1.7.3.4 – Approve and obtain the final logo in all required formats
Each step is a blocking task for the next one, in a strictly Finish-to-Start logic.
You cannot select a logo if the concept has not been presented, you cannot test a logo that has not yet been chosen, and you cannot generate final files until it has been approved.
These are critical tasks: the slightest delay on any of them shifts the entire schedule.
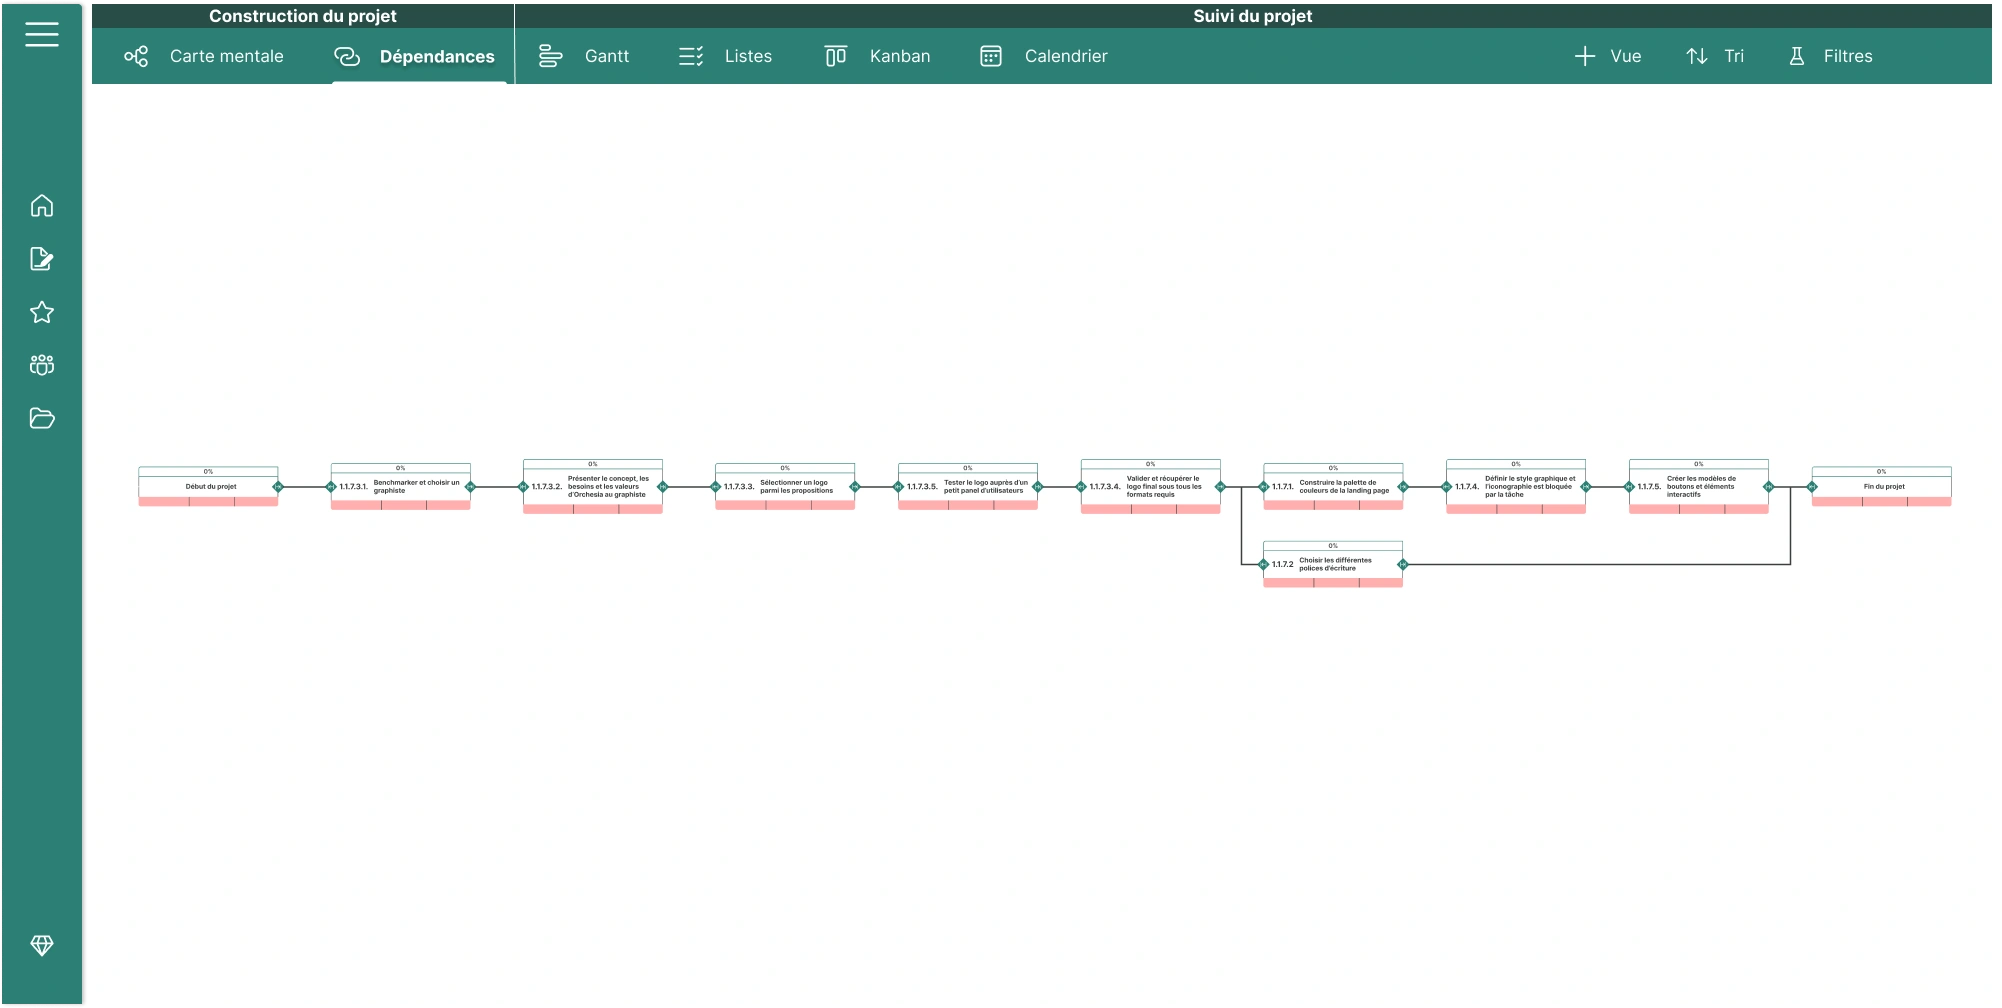
Result: a clear visualisation of the network
The PERT diagram for this example clearly shows:
- a long, linear critical path that cannot be shortened;
- a few tasks that can be run in parallel, but are not structuring;
- tipping points where a single deliverable (here, the logo) unlocks a large number of subsequent steps.
This is exactly the kind of situation where PERT reveals its full value:
It shows at a glance what really drives the project duration and highlights the critical tasks on which you cannot afford to lose a single day.
What comes after PERT?
Your PERT diagram is not an end in itself; it is the backbone of the schedule. Once it is in place, you can move on to network calculations. This is a crucial step in rigorous project planning: it determines the start and finish dates of each task, identifies the critical path and calculates the float available on each activity.
Better still, it becomes the basis for automatically generating a Gantt chart, which is much easier to read for day-to-day tracking.
Mastering the PERT diagram transforms the way you manage projects. By visualising complex dependencies, you secure your deadlines and anticipate bottlenecks. To move from theory to practice effortlessly, using dedicated software remains the best option to guarantee reliable and agile planning.
The advantage of a project management tool
Drawing a PERT diagram by hand on a whiteboard? It’s an excellent pedagogical exercise. But on a real project, it quickly becomes tedious, hard to read and above all a source of human error.
This is where a tool like Orchesia changes everything. Your tasks from the WBS are already there. You click, you connect dependencies, and the diagram draws itself before your eyes. No more geometric headaches.
The real benefit shows over time. At the slightest change, the software instantly recalculates the entire network.
FAQ
How do you build a PERT diagram step by step?
Building a PERT diagram must always start with creating a Work Breakdown Structure (WBS) to list all elementary tasks. Then, you apply the precedence method by asking three questions for each activity: which task must be completed before (predecessor), which task can follow (successor), and which tasks can be carried out in parallel. The diagram is drawn from left to right, linking tasks with arrows to represent dependencies, while identifying the critical path that will determine the project’s minimum duration.
Which software should you use to generate a PERT diagram?
Although it is possible to sketch a network manually, using dedicated project management software such as Orchesia is recommended to gain in efficiency and reliability. This type of tool allows you to import tasks directly from the WBS and create links (blocking or blocked tasks) in just a few clicks. The key advantage lies in automated calculations: the software instantly computes the earliest and latest dates, free and total float, as well as the critical path, and updates the schedule dynamically whenever a change occurs.
What is the difference between a Gantt chart and a PERT diagram?
The core difference lies in their visual purpose. The PERT diagram is a logical network that emphasises dependencies between tasks and the structural sequencing of the project, which makes it ideal for the initial planning phase and for identifying the critical path. In contrast, the Gantt chart is a linear calendar-based representation, better suited to day-to-day operational tracking and to visualising task progress over time once the network logic has been validated.
What is the three-point PERT estimating method?
The three-point PERT estimating method is a duration-estimation technique designed to address the uncertainty inherent in complex projects. Instead of committing to a single duration, it considers three scenarios for each task: an optimistic estimate (everything goes well), a pessimistic estimate (worst-case scenario) and a most likely estimate. A weighted average formula is then used to obtain a more realistic expected duration, which helps make the calculation of the critical path and available float more reliable.
Try our project management software Orchesia free for two weeks, no commitment!