PERT Diagram Calculations: Determine Earliest/Latest Dates, Floats, and Your Project’s Critical Path
Estimated reading time : 10 minIn the previous article on building the PERT diagram, the elementary tasks were positioned according to their logical order of succession. Their durations were estimated and entered during the creation of the WBS.
From these elements, a few simple calculations allow the project manager to perform the network calculation, also called the PERT diagram calculation. The goal: determine the earliest and latest start and finish dates for each task, identify the critical path, and calculate the available float for each task.
To do this, you need to perform what project management calls: earliest-time scheduling and latest-time scheduling.
Earliest-Time Scheduling: How Does It Work?
To perform earliest-time scheduling, start from the first tasks in the project (those on the far left in the PERT diagram) and move left to right along all network paths until the project’s final tasks.
On each path, simply add the task durations to determine the earliest start date of the following tasks. The longest path (in cumulative duration) is the critical path, if no project end date is imposed. This path sets the project’s minimum duration.
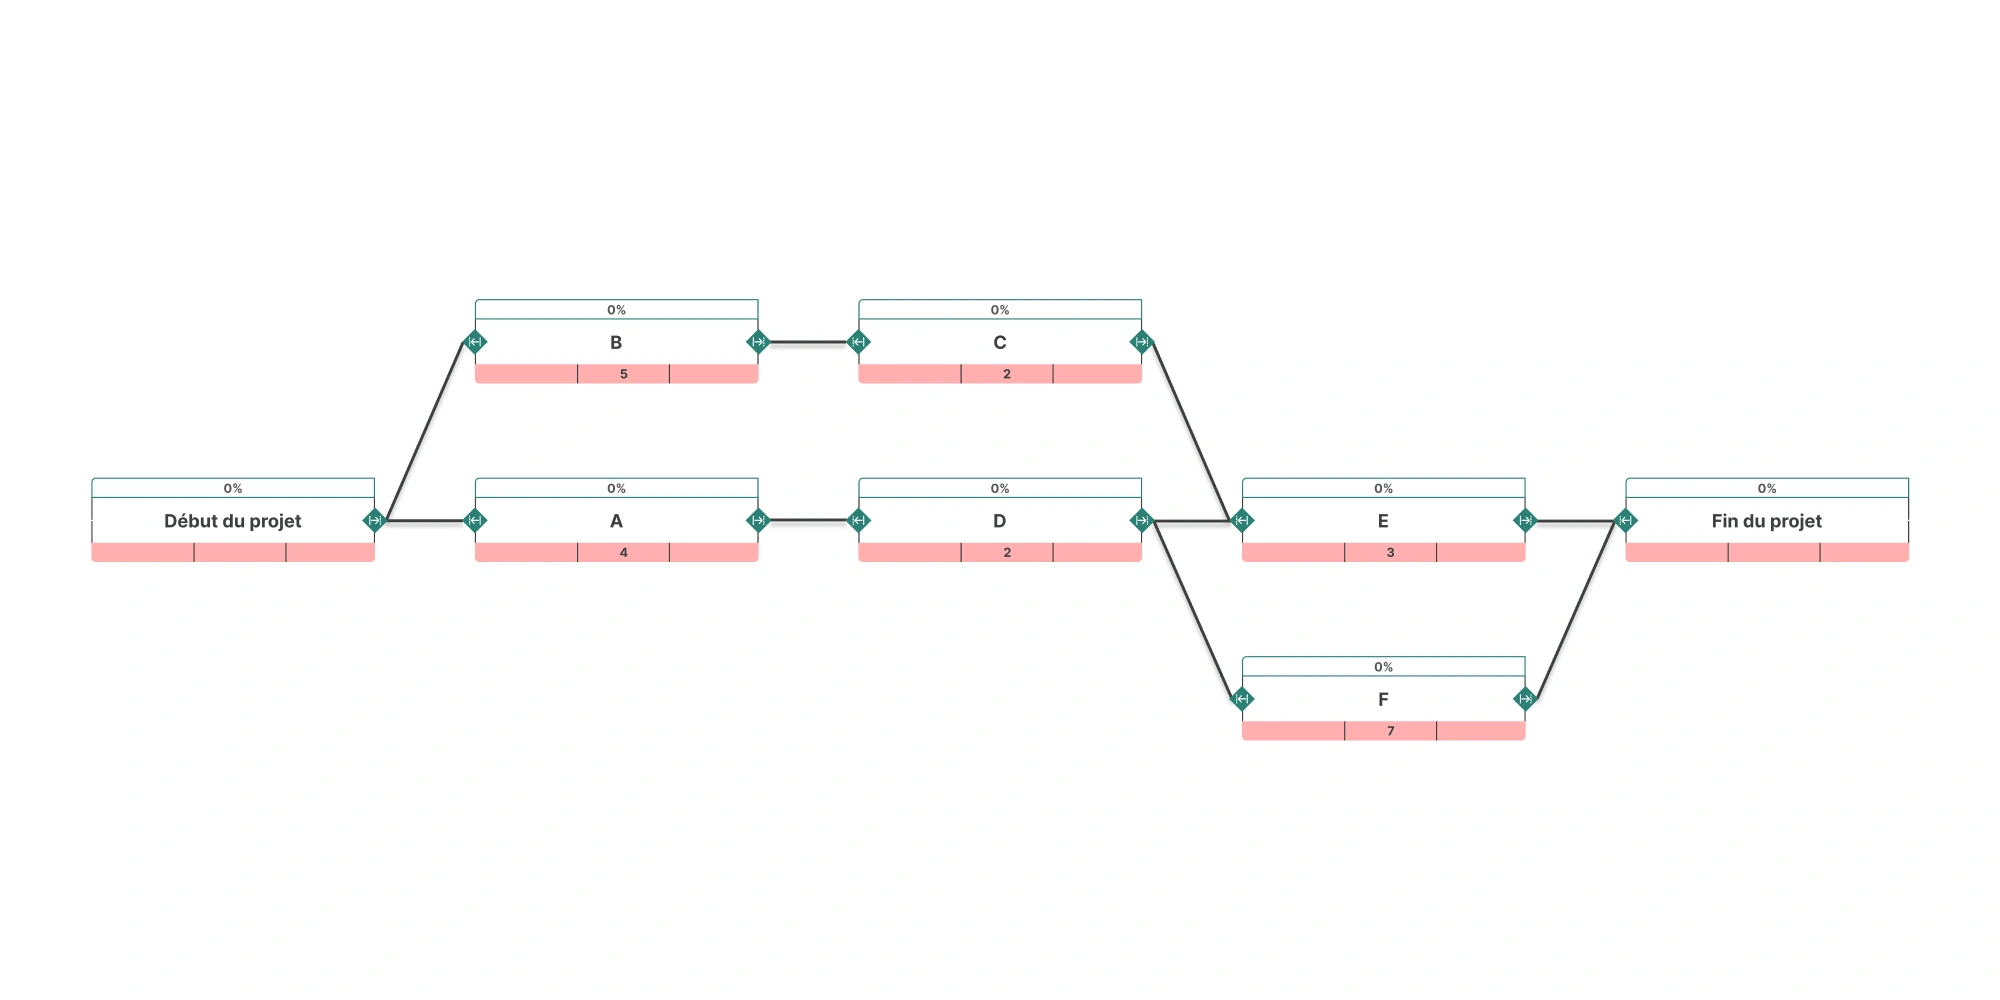
Simple Example of Earliest-Time Scheduling
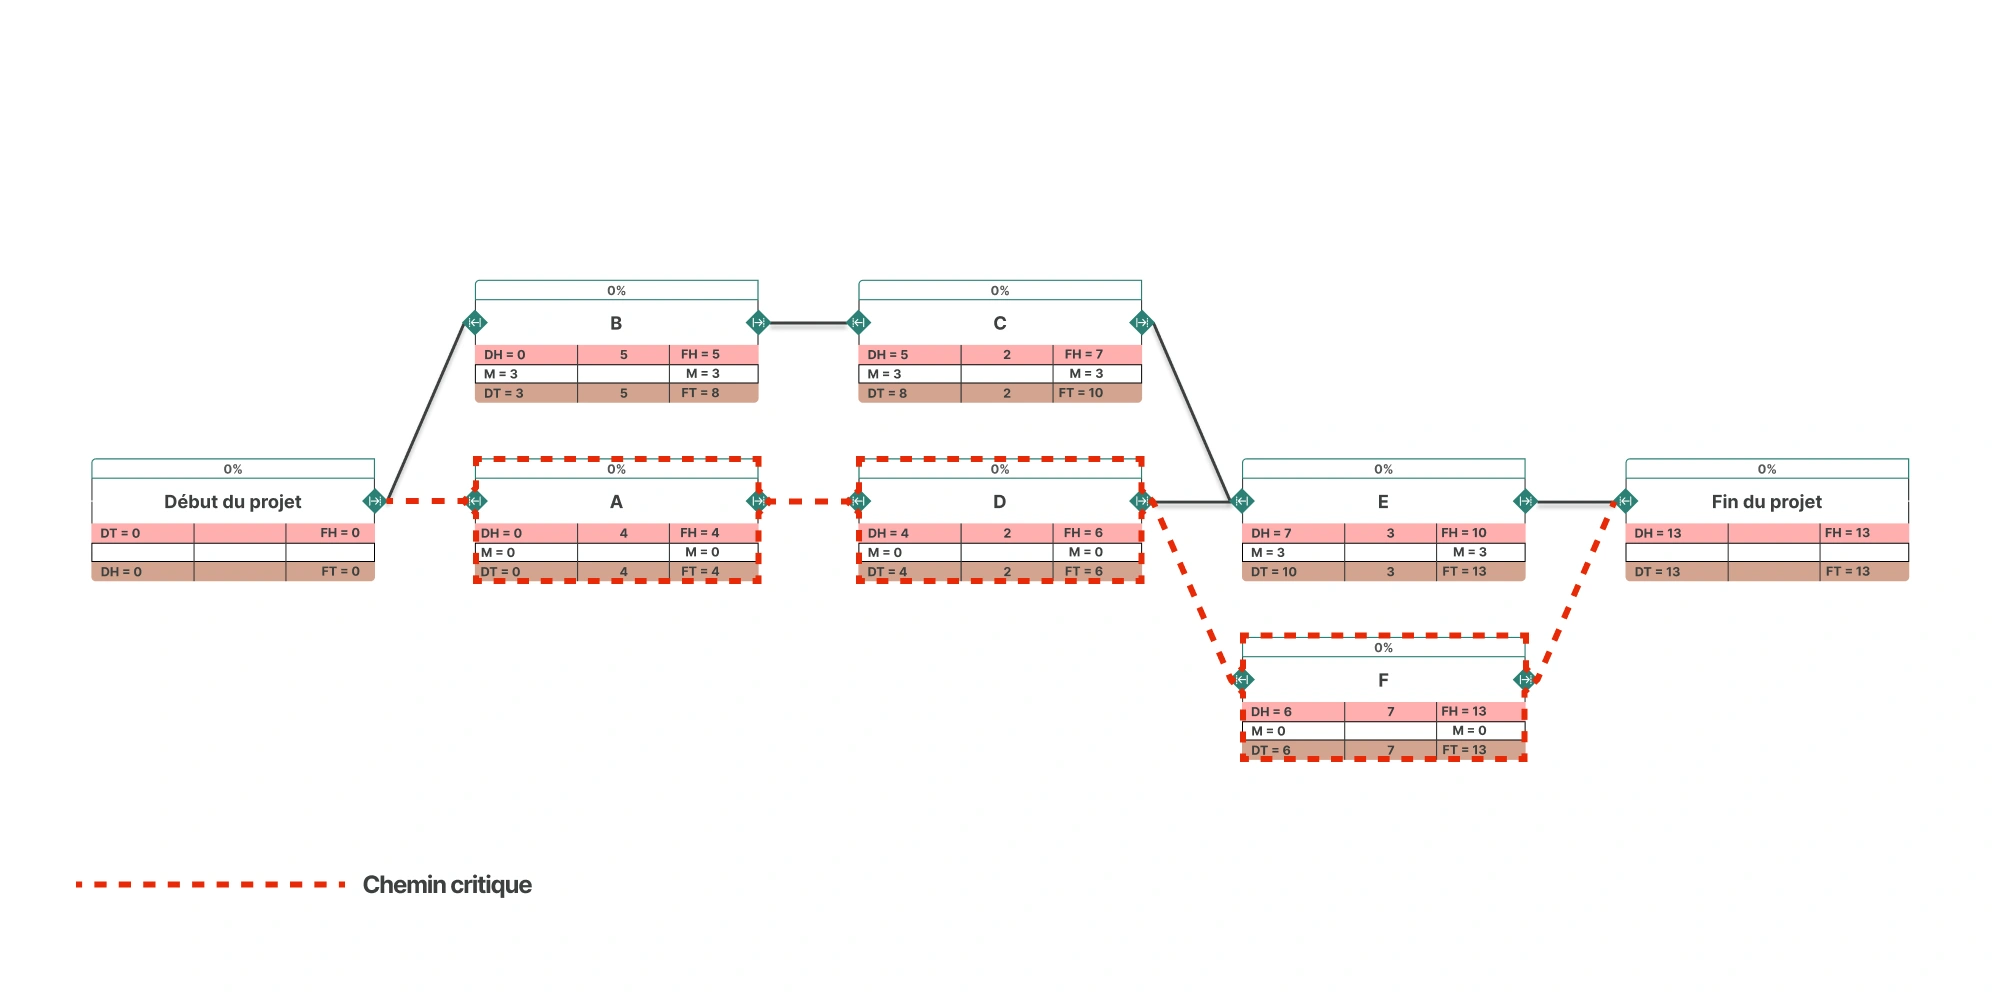
Imagine a project made up of 6 tasks, spread across 3 different paths:
- Path 1: A → D → E
- Path 2: B → C → E
- Path 3: A → D → F
Task durations are as follows:
- A: 4 time units
- B: 5 time units
- C: 2 time units
- D: 2 time units
- E: 3 time units
- F: 7 time units
Thus, by performing earliest-time scheduling, we obtain the following durations for each project path:
- Path 1: A → D → E = 4 + 2 + 3 = 9 time units
- Path 2: B → C → E = 5 + 2 + 3 = 10 time units
- Path 3: A → D → F = 4 + 2 + 7 = 13 time units
The critical path is therefore Path 3, because it’s the longest. The total project duration will be 13 time units.
All the tasks that make up this critical path (A, D, and F) are called critical tasks. Any delay on one of them will immediately shift the project’s finish date, because no float is available on this path.
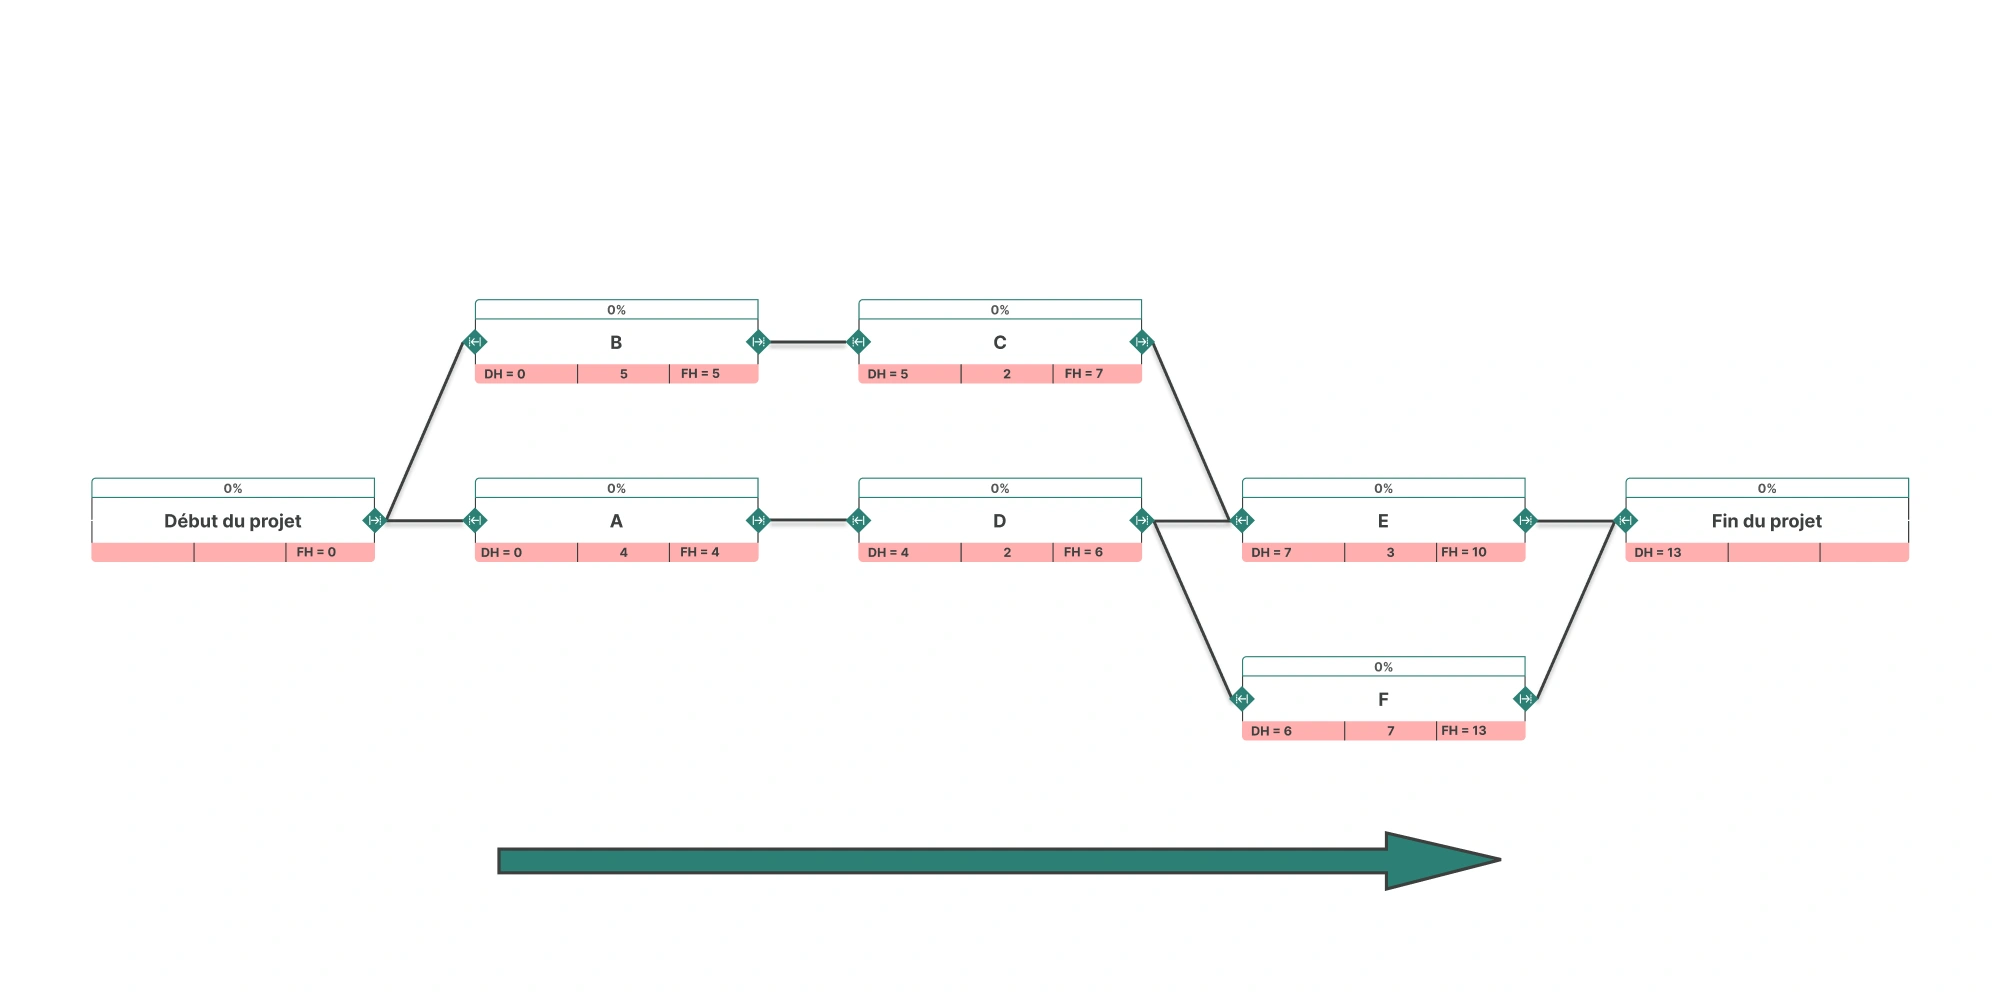
Earliest Dates
At this stage, each task in the diagram can be associated with two important early dates:
- An earliest start date, called Earliest Start (DH)
- An earliest finish date, called Earliest Finish (FH)
The calculations are simple:
- FH [of task i] = DH [of task i] + duration [of task i]
- DH [of task i] equals the highest earliest finish among all tasks that immediately precede it.
In our example, to calculate DH [of task E], take the two tasks that precede E—C and D—compare their FH values, and choose the higher one.
- FH [of task C] = 7
- FH [of task D] = 6
The higher FH is that of C, so DH [of task E] = FH [of task C] = 7
Latest-Time Scheduling: How Does It Work?
Latest-time scheduling consists of calculating the network from the project’s last tasks (those on the right in the PERT diagram) and moving right to left through the network paths to the project’s first tasks.
This scheduling is relevant only if the project is bounded, i.e., if an end date is set. This date may be:
- either derived from the earliest-time calculation (i.e., the Earliest Finish of the last task on the critical path),
- or imposed externally, for example by a client, a product launch, or a fixed-date event.
Once this deadline is known, apply the same logic as for earliest-time scheduling, but in reverse:
- Start by assigning a Latest Finish (FT) to the last task, equal to the project’s end date.
- Then calculate the Latest Start (DT) for each task, as well as the Latest Finish (FT) of its predecessors.
The calculations also remain almost the same
- DT [of task i] = FT [of task i] - duration [of task i]
- FT [of task i] equals the lowest latest start among all tasks that immediately follow it.
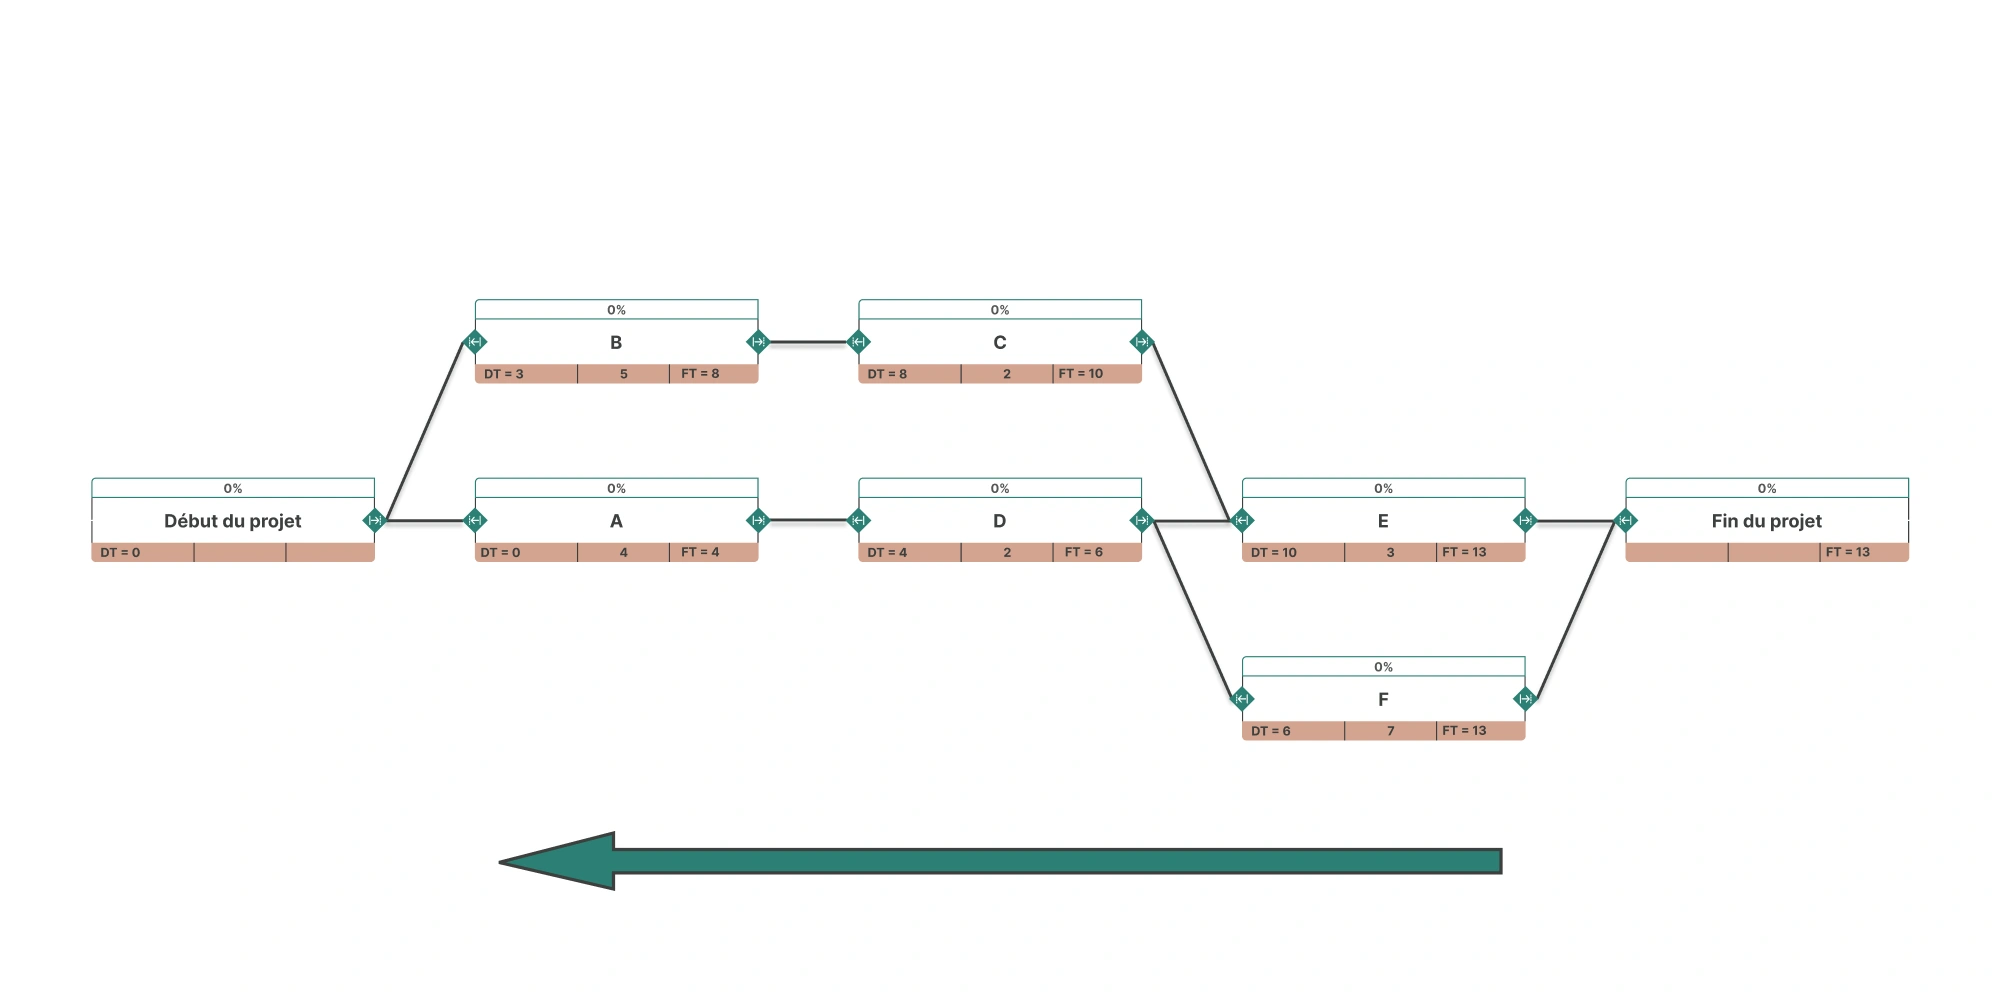
Latest Dates
In our example, to calculate FT [of task D], take the two tasks that follow it—E and F—compare their DT values, and choose the lowest one.
- DT [of task E] = 10
- DT [of task F] = 6
The lowest DT is that of F, so FT [of task D] = DT [of task F] = 6
We now know the latest dates for each task
Calculating Floats and Determining the Critical Path
A task’s float, or total float, indicates how many time units a task can be delayed without delaying the project’s finish.
In other words, it’s the number of time units you can add to a task’s earliest finish without impacting the project’s planned end date.
It is calculated very simply using one of the following two formulas:
- M = DT – DH (Latest Start – Earliest Start)
- M = FT – FH (Latest Finish – Earliest Finish)

It’s important to understand that a task’s float isn’t “free”: if a task uses all or part of its float, this directly impacts the tasks that follow.
Indeed, the earliest start dates of subsequent tasks will automatically shift, which reduces their own float.
In our diagram, task B has a total float of 3 time units. If it is extended and lasts 8 time units instead of 5, then the earliest start of the next task C will automatically be shifted by 3 units.
We will therefore need to recalculate all dates (DH, FH, DT, FT) for downstream tasks, because some may lose their float or even become critical.
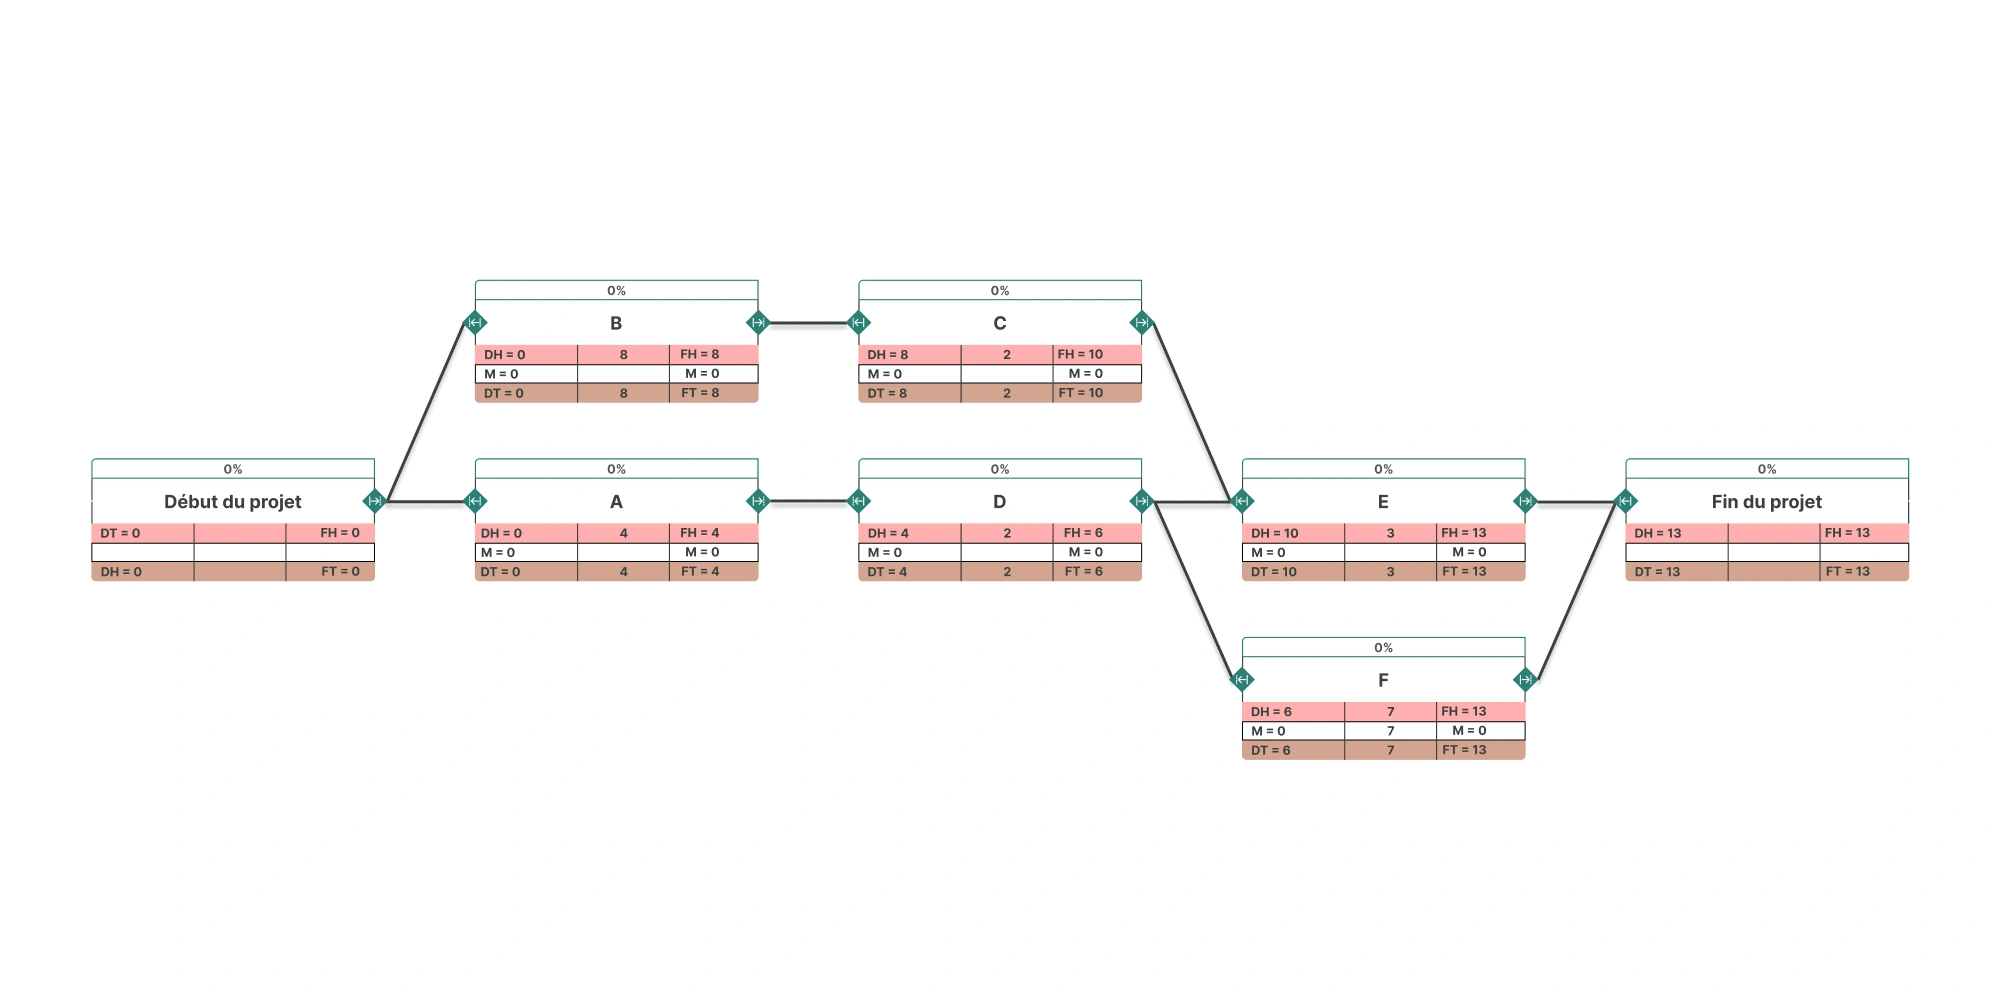
The critical path(s) correspond to the paths for which total float is zero. These tasks cannot be delayed, otherwise the project’s overall deadline is affected.
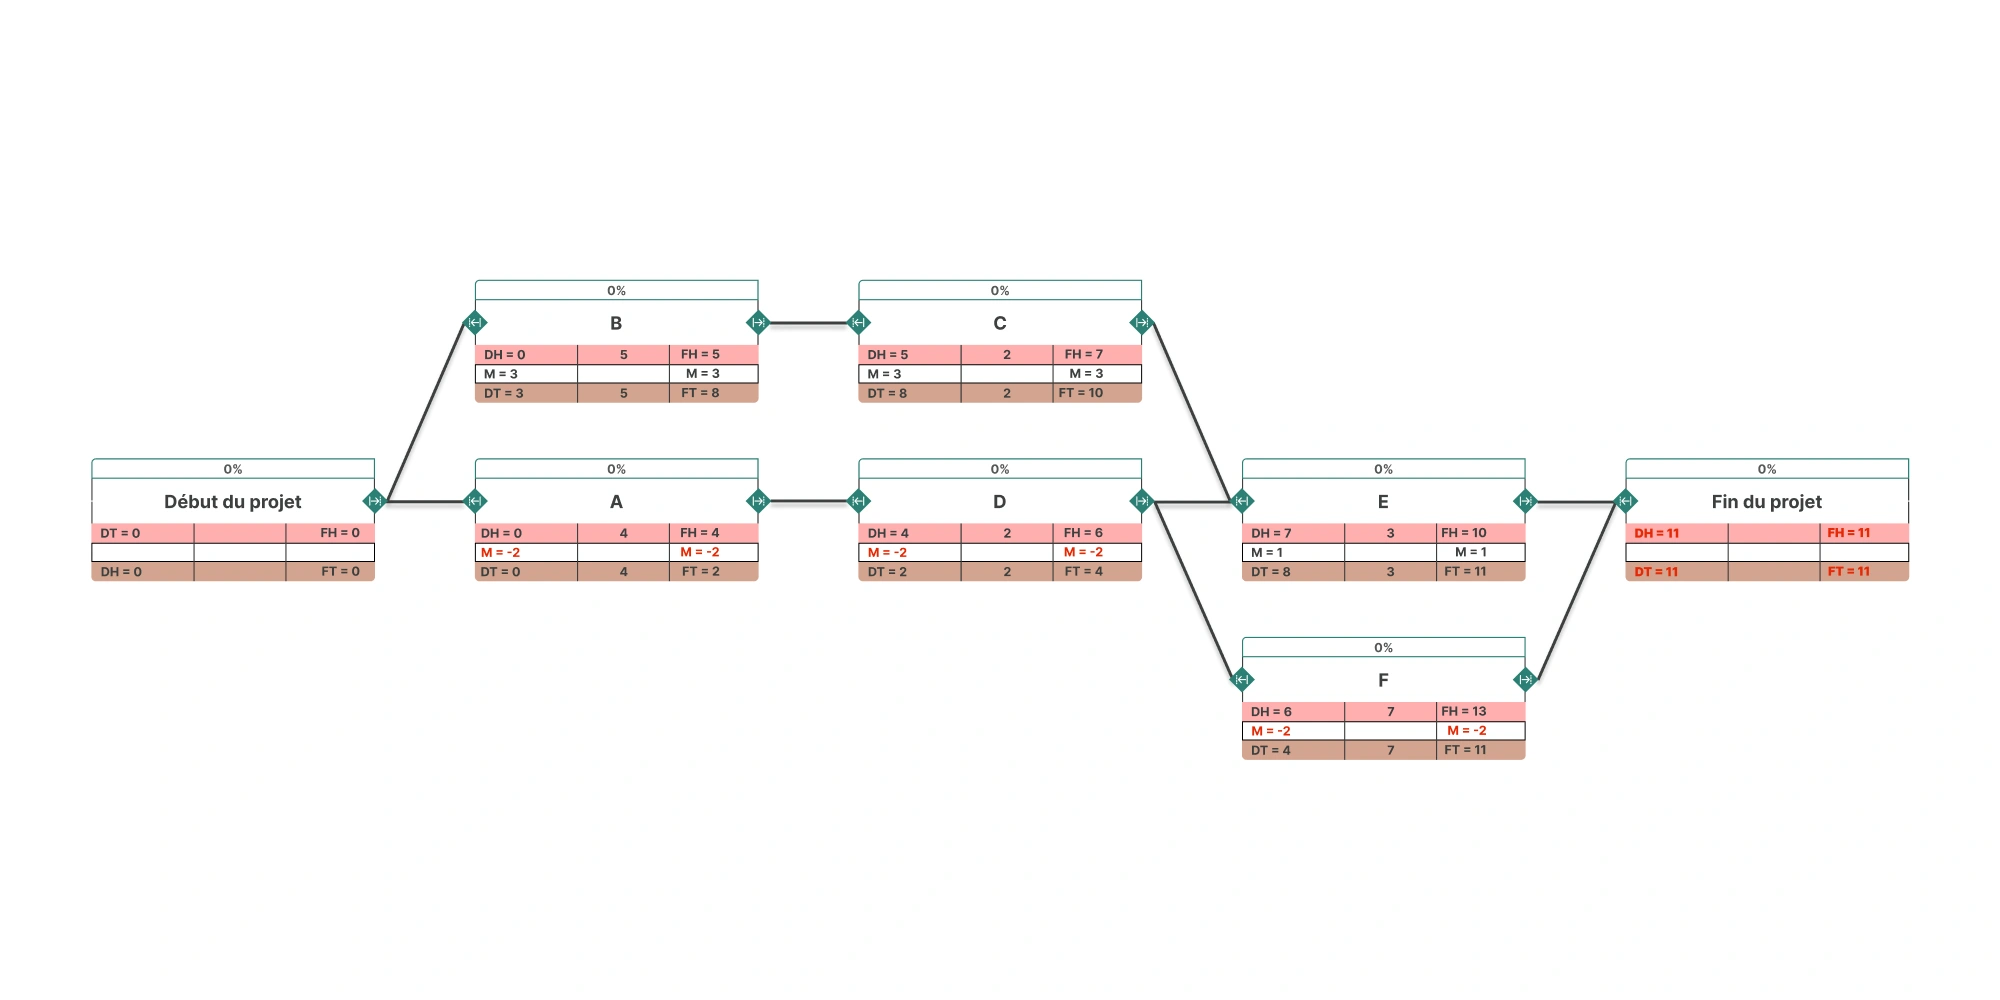
Negative Float: A Planning Error to Fix
In some cases, it’s possible to see negative floats. This occurs when a project end date is imposed earlier than the one calculated during earliest-time scheduling—i.e., earlier than the project’s Earliest Finish (FH)—and the project start date cannot be moved forward.
If, in our example, the PERT diagram indicates a total duration of 13 time units, but an end date at 11 units is imposed, then some tasks will end up with a negative total float.
This means the current schedule cannot meet the deadline without adjustments. Three main levers can be used:
- Reduce the duration of the task in question
By revising its scope, adding resources, or optimizing execution (a compression technique).
- Move the project start date earlier
By adjusting the Earliest Start (DH) of certain upstream tasks, the constraint is distributed across the entire critical path.
- Shift the project’s end date
By adjusting the Latest Finish (DT) of the final task, you acknowledge the current deadline is not achievable and accept an overall project shift.
Negative floats are therefore a strong warning signal: the project is under strain, and decisions must be made.
Orchesia, the Software that Automatically Calculates Your PERT Diagram
With Orchesia, the “Dependencies” view lets you build your project’s PERT diagram in just a few clicks.
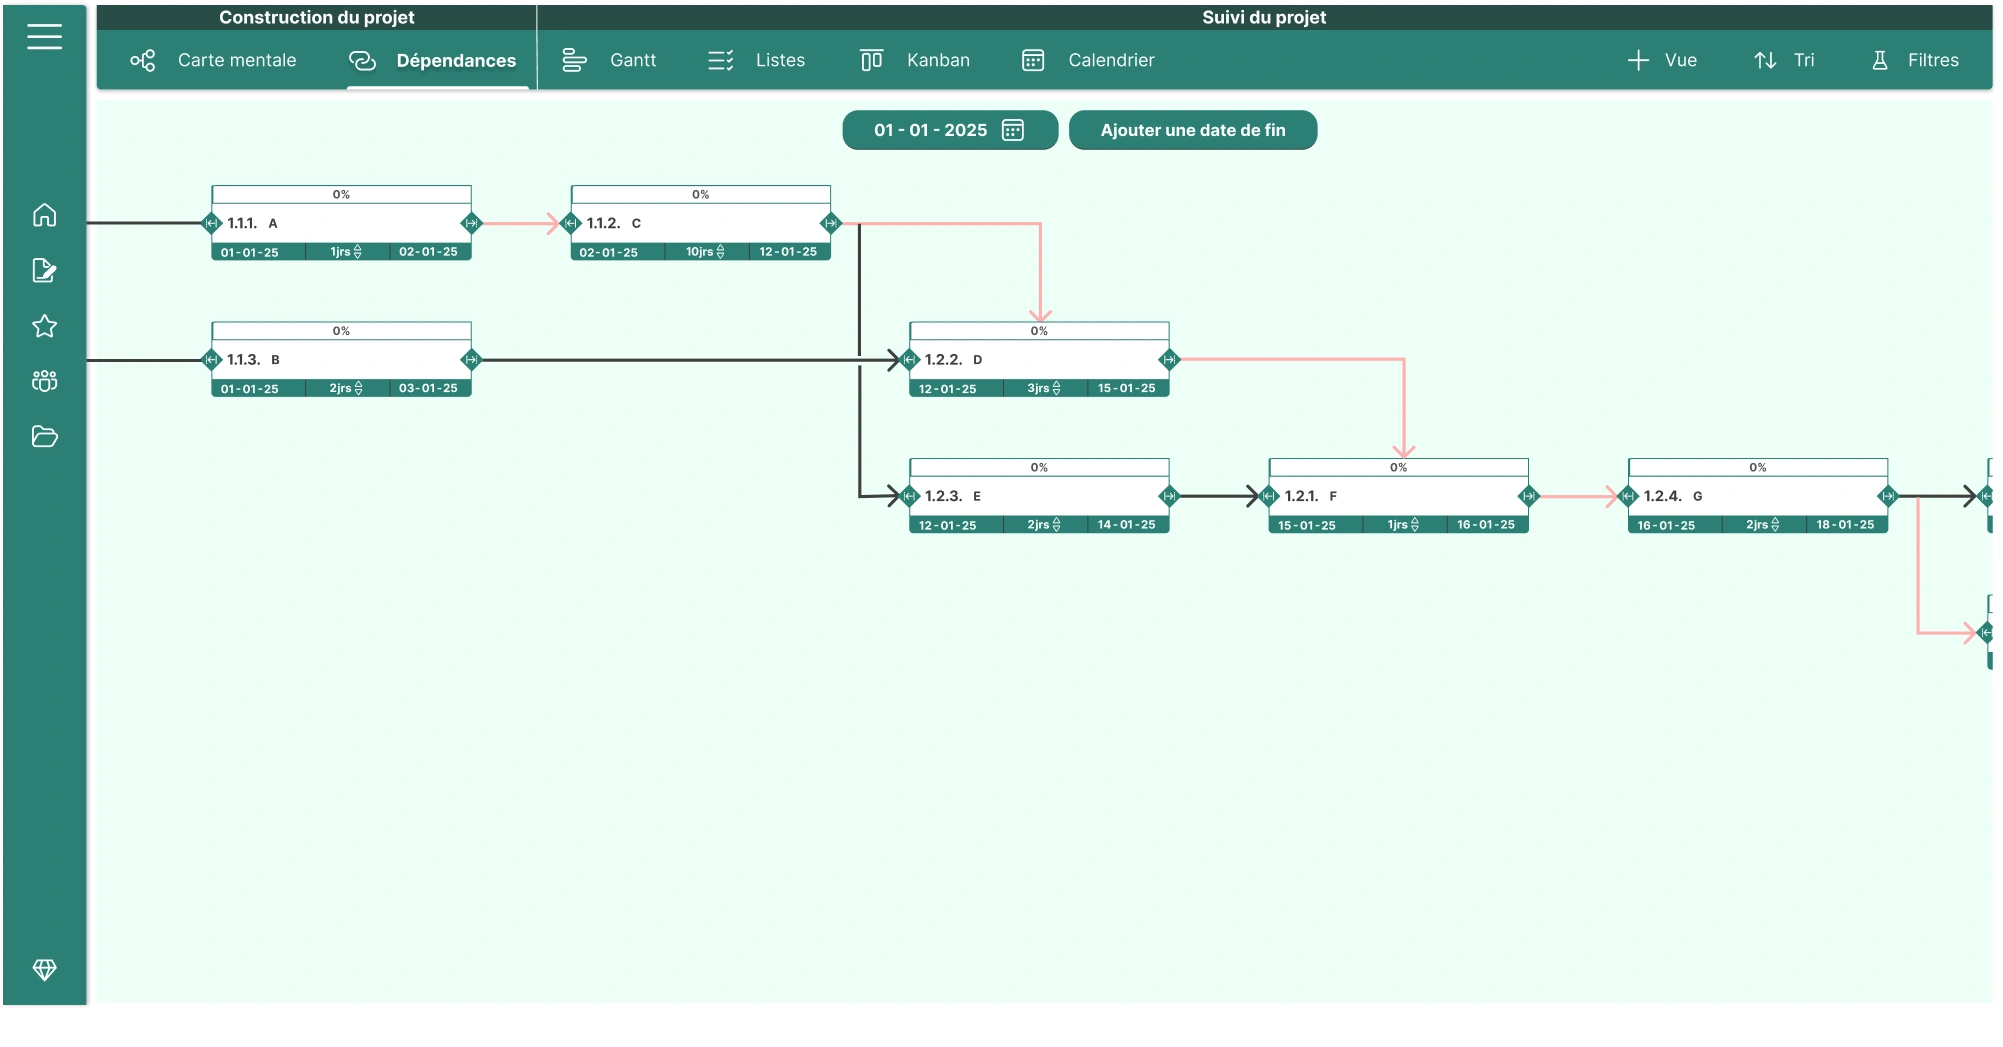
Task durations are automatically pulled from the estimates entered in the “Mind Map” view.
You then just need to:
- enter a project start date,
- choose your time unit (day, week, month…),
And Orchesia performs earliest-time scheduling for you:
- each task receives its earliest start and finish dates,
- the critical path is identified and highlighted,
- you immediately know whether a task is critical or not.
You can also impose a project end date.
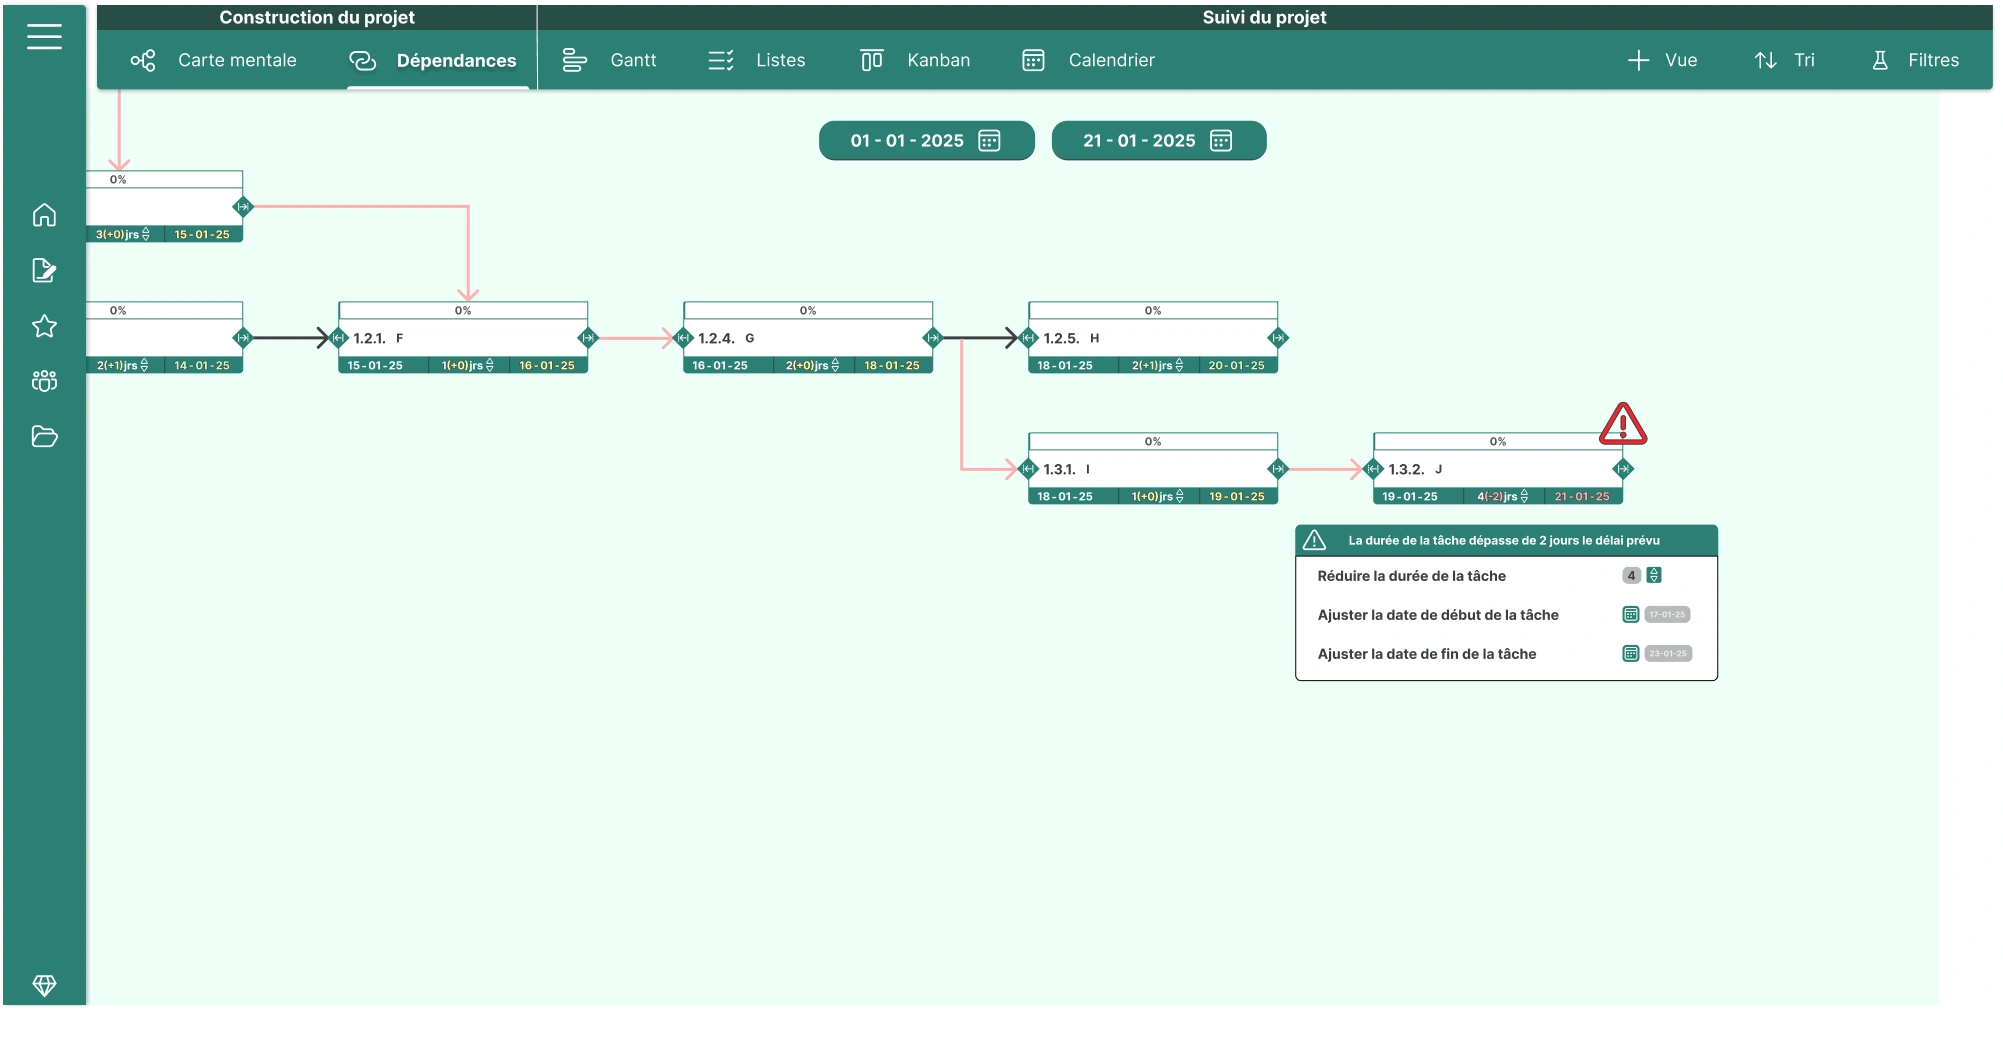
Orchesia then automatically calculates latest-time scheduling and displays:
- the latest start and finish dates for each task,
- the total float available for each of them.
If negative floats occur, you’re alerted immediately, allowing you to quickly correct your schedule.
And at the slightest change—duration modification, dependency added, rescheduling—the diagram updates instantly: you immediately see the impact on the network, floats, and the critical path.
Try our project management software Orchesia free for two weeks, no commitment!